Budget planning doesn’t stop with the close of the previous year.
Starting the year with a high-value beginning-of-year (BOY) content performance report is the perfect way to sum up the past year’s wins and learnings plus keep tabs on the current year. To prepare and move forward, decision-makers need clear metrics they can count on
to make budgeting decisions.
Content teams looking to prove their value to decision-makers need to use granular, relevant data to contextualize and surface their impact on a business’s bottom line. Doing this convinces bosses of content’s continued relevance and importance in the upcoming year.
Prove to decision-makers that content as an area of marketing is worthwhile
Reports are notorious for including a smattering of numbers for numbers’ sake. However, numbers with no context are unhelpful. Decision-makers need to see plain numbers, trends, and recommendations of where to invest (and divest) in the coming year, placed in the context of the organization and the broader industry.
Be ready to defend content as a concept. As a marketer, you know that content is a long term game, but decision-makers need to be convinced to hold out for the long-term benefits that you’re building toward. Keep decision-makers focused on the future, no matter if you’re a department of one or dozens.
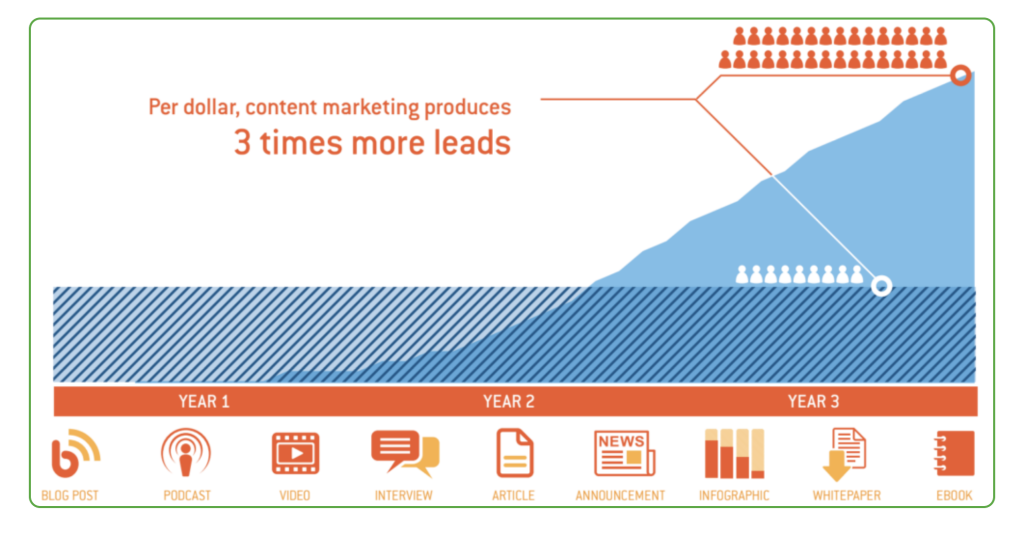
Check out this visualization of three years’ worth of content marketing efforts by Databox, and the proof is in the pudding: content marketing tripled the amount of sales-ready leads they raked in after building the content program for three years.
Another fertile area to show content’s overall impact, if it’s still a relatively new area for your organization, is in the past years’ reports, if you have them. Mine those reports for longer-term, historical marketing successes achieved with content as shining examples of all the good content has already done for your marketing program.
Year-over-year reports are much more valuable in demonstrating content’s opportunity to drive revenue to the business. As opposed to other areas of marketing, like pay-per-click, which typically require a monthly cadence for reporting results, content performance help prove to executives how content can be an integral part of the overall business strategy and a worthwhile revenue stream to invest in.
One-third of respondents expected their organization would spend more on content marketing during the second half of 2020 than the first half. 24% said their organization had shifted traditional paid advertising dollars to content marketing in the last 12 months.
– CMI’s 2020 B2B Content Marketing Survey: Benchmarks, Budgets and Trends
Set Context with the report’s numbers
Context is everything. Numbers shared with decision-makers need to make sense at a glance. Sum up key findings per section, and structure the report with readability (and scanning) in mind. You also need to be mindful that decision-makers may not know all the jargon you use day-today. Don’t assume that terms like “organic traffic,” “conversions,” or “time on page” resonate; be prepared to define them in simple definitions.
Here are some examples of how to parse out relevant segments of your data and set the context for the reviewer:
- Split apart relevant segments of traffic. Examples of this could be blog vs. non-blog traffic to your site, customer vs. non-customer traffic, organic vs. paid traffic, etc.
- Compare time metrics to benchmarks or past performance. For example, compare your “time on page” to your industry averages, past benchmarks on that piece of content, or what can be expected time-wise relative to how long the piece was.
- Consider using timeline visualizations. These are useful for evergreen measurements, like traffic or domain authority. Annotate intervals where you see changes in the metrics. Examples of what to annotate include:
- Product launches
- Big marketing campaigns
- Backlinks built
Below is an example of this in practice on a month-over-month plotting of pageviews, with key dates circled. If there’s a change in the trendline after a major occurrence, the dotted lines are drawn to show this type of change:
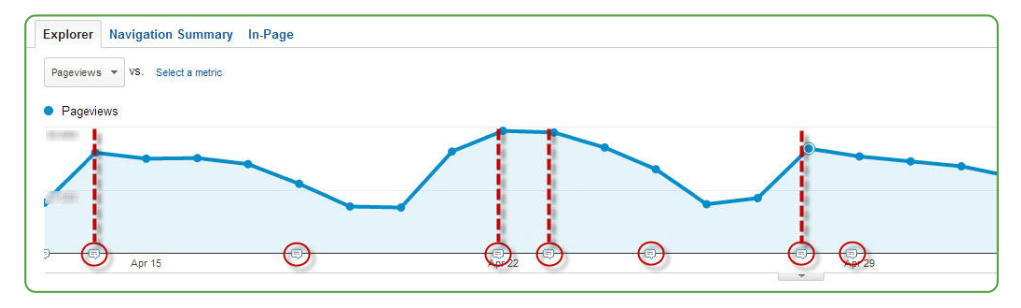
- Restate prior goals and chart progress against them. Be explicit about which metrics you previously set goals for and how you measured against those goals. This gives decisionmakers better visibility into previous content objectives and how much progress has been made.
Showcase successes with key results around audience engagement metrics
Ideally, your organization already has agreed-upon KPIs (key performance indicators) from last year’s goal setting. Ensure you chart metrics against those KPIs to speak the same language as your decision-makers.
And you’re in good company. 2020 research conducted by CMI states that “more than three-fourths (78%) of B2C marketers use metrics to measure content performance; of these, 63% have established KPIs and 51% measure content marketing ROI.” Although a majority are measuring content performance, the numbers are whittled down from there for companies tracking content analytics in a meaningful way, such as mapping KPIs and tying content back to ROI.
“More than three-fourths (78%) of B2C marketers use
metrics to measure content performance; of these,
63% have established KPIs and 51% measure content
marketing ROI.”
Not sure which KPIs to focus on? Consider looking at audience engagement as your North Star metric for success. If you don’t currently measure engagement, you’re limiting how much you understand about your audience and exactly how your content resonates with them. Don’t fall into the trap of relying on vanity metrics, which frequently are easier to measure and center on big numbers, like traffic, for optics. From the same research, CMI reports that “81% of B2B marketers report their organization uses metrics to measure content performance. Website traffic (90%) is the metric that is used most often.” Traffic, by itself, is virtually useless if you don’t know what actions those visitors are taking.
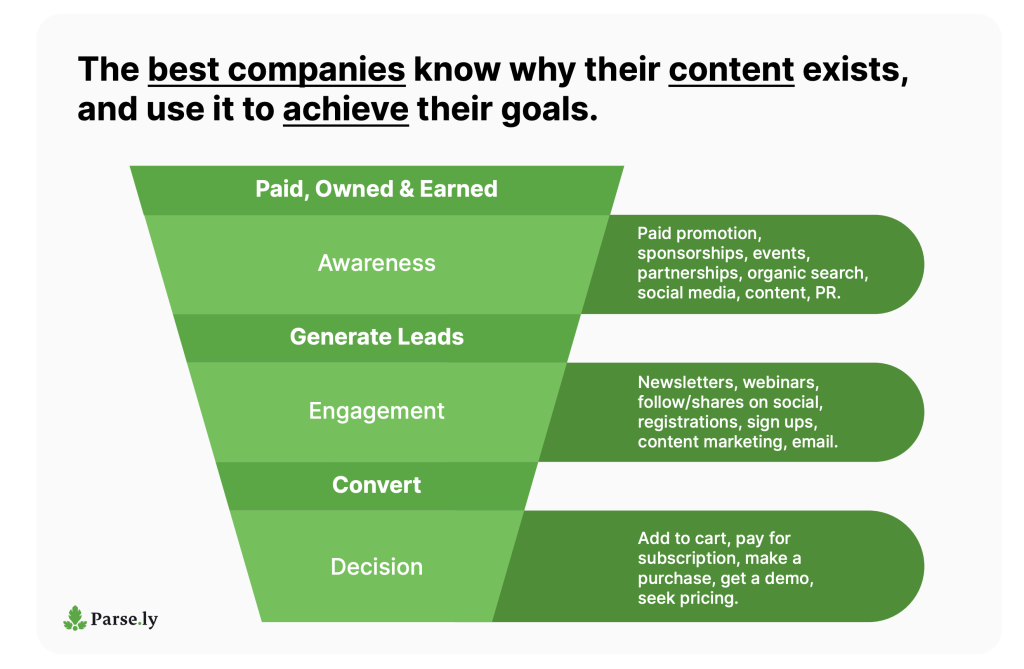
To measure audience engagement, first isolate marketing activities or goals that can be driven by content. In practice, these could be gated content downloads, conversion of visitors to marketing or sales qualified leads (MQLs & SQLs), clicks on CTAs, newsletter subscriptions, etc. Each of these activities should then be divvied into designations of top-of-funnel, middle-of-funnel, and bottom-of-funnel to track each of those stage’s successes, as success looks different at each point in the sales process. These successes resonate even better if they drive revenue (think bottom-of-funnel), such as course downloads, coupons, freemium conversions to customer, etc.
Parse.ly has been measuring audience engagement via a heartbeat pixel (and loads of other custom scripts) for clients for years, while other analytics platforms fall short and mistakenly rely on metrics like bounce rate to represent engagement. What’s a heartbeat pixel? It essentially tracks a “heartbeat” of a user on a web page, pinging the browser every few seconds to check if the user is still active if a) the tab is still open, and b) the user is engaging with the page by clicking, scrolling, playing videos, etc.
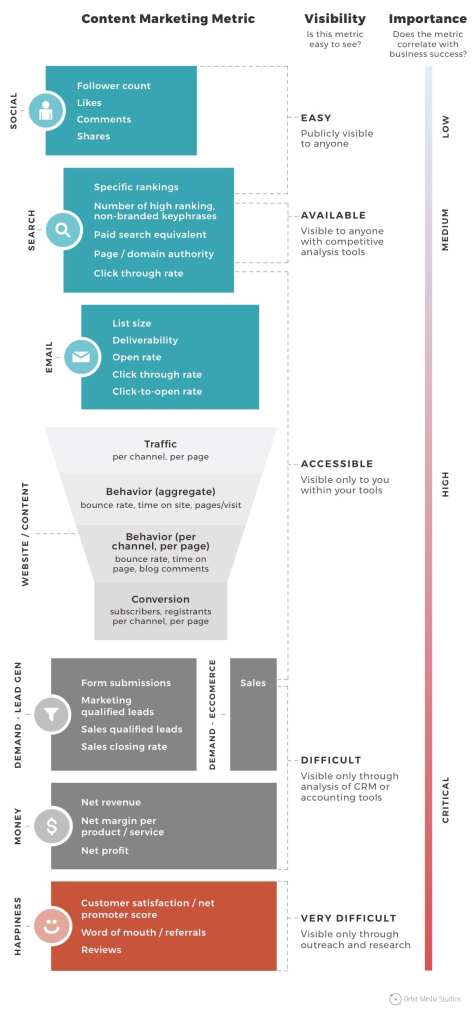
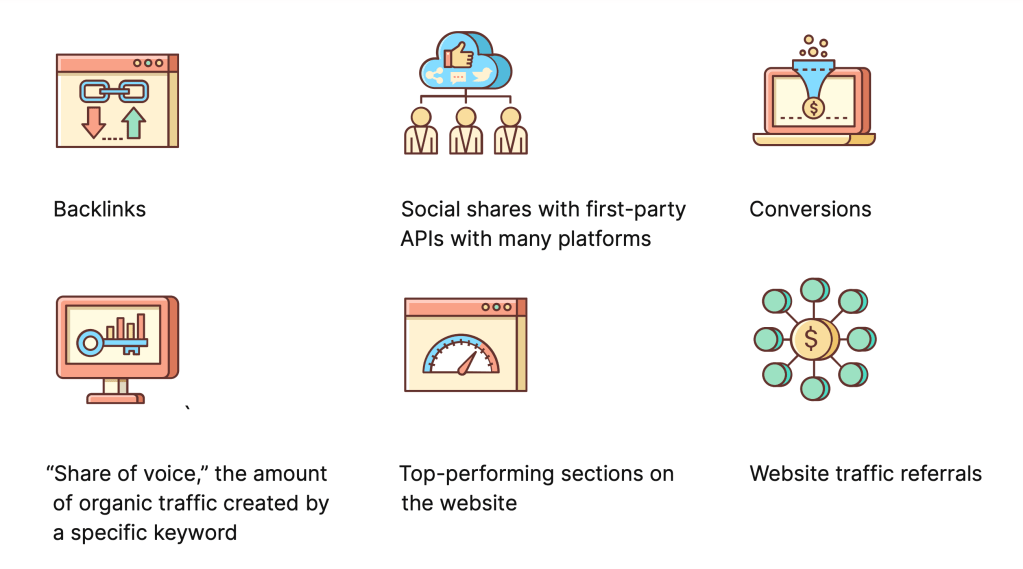
For more ideas on metrics to track with respect to your content marketing efforts, consider the metric’s category, visibility, and importance, according to this illustration from Orbit Media Studios.
This is a good starting point for considering the potential content marketing metrics that may prove meaningful to you and your organization’s decision-makers.
Present examples of content aligning with key metrics
Showcasing metrics in practice with a few pieces of content to share learnings, whether positive or negative, can help contextualize what a piece of content can do for your company. For each example, what made it successful, quantitatively?
Examples
This blog post got two backlinks within a month of publishing, bumping the domain authority of our site from 50 to 60 in the course of a quarter.

This is the most-cited blog post in sales conversations about how the lead found out about the company, showing an immediate ROI.
Find and track impactful data (and the best tools for the job)
Data collection means nothing if you’re not able to act on the insights you uncover. When vetting a content analytics tool, ensure the insights provided are actionable and all but beg for next steps to be taken.
Useful data has one purpose—to get you to the crucial next step of adjusting strategy and
execution. When looking at content analytics offerings, a tool that offers actionable data is better than a tool that simply offers a large quantity of data.
Google Analytics is a commonly used tool because it’s free, but is a textbook example of too many insights that are complicated to gather and not particularly actionable. Tools like Moz or Ahrefs are helpful, but they’re not as comprehensive, and they’re more focused on tracking SEO metrics, like domain authority or number of backlinks. They also don’t account for more in-depth measurements like audience engagement.
After all, you can only improve what you track in an ongoing fashion. This rigor is paramount to success and only feasible when working with an analytics tool that makes it as easy as possible to glean actionable insights. If you’re not looking at a metric on a regular cadence (i.e., to compare against a goal), its use to you is limited, especially in a reporting capacity to sum up the year.
Parse.ly is designed with actionability in mind. That’s why it parses out true audience engagement from vanity metrics. Parse.ly also offers specific content performance reports that can help users present the strongest cases to key decision-makers.
Evergreen Report
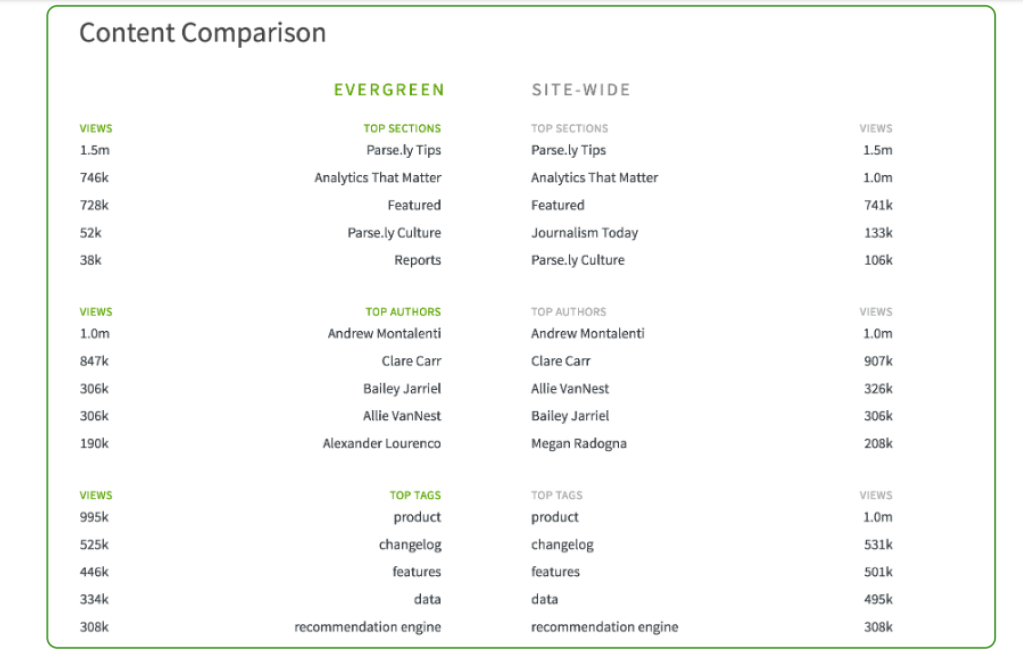
Parse.ly’s Evergreen Report compares the most-viewed evergreen content with the most-viewed content site-wide by section, author, or customizable tags. This report is specifically for evergreen content designed to have long-term benefits that will stay timely as time goes on.
These tried-and-true pieces of content will be mainstays on your content performance reports moving forward. This report uniquely illustrates the power of amassing foundational content to build your content program on into the future.
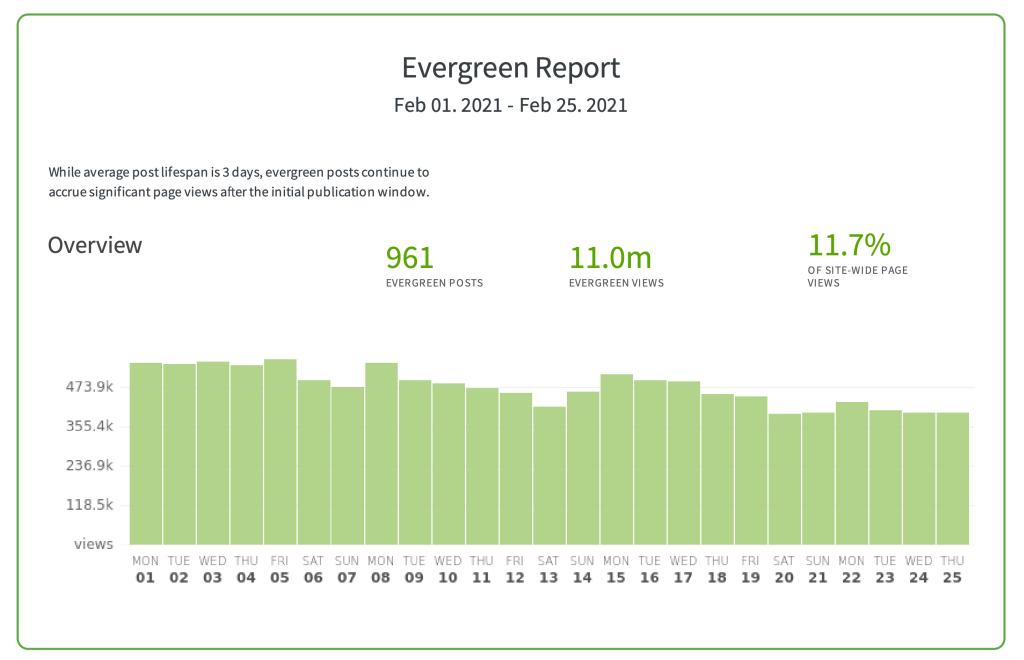
The Evergreen Report also includes a visualization of the number of posts and views, as well as how these evergreen posts compare to all sitewide pageviews.
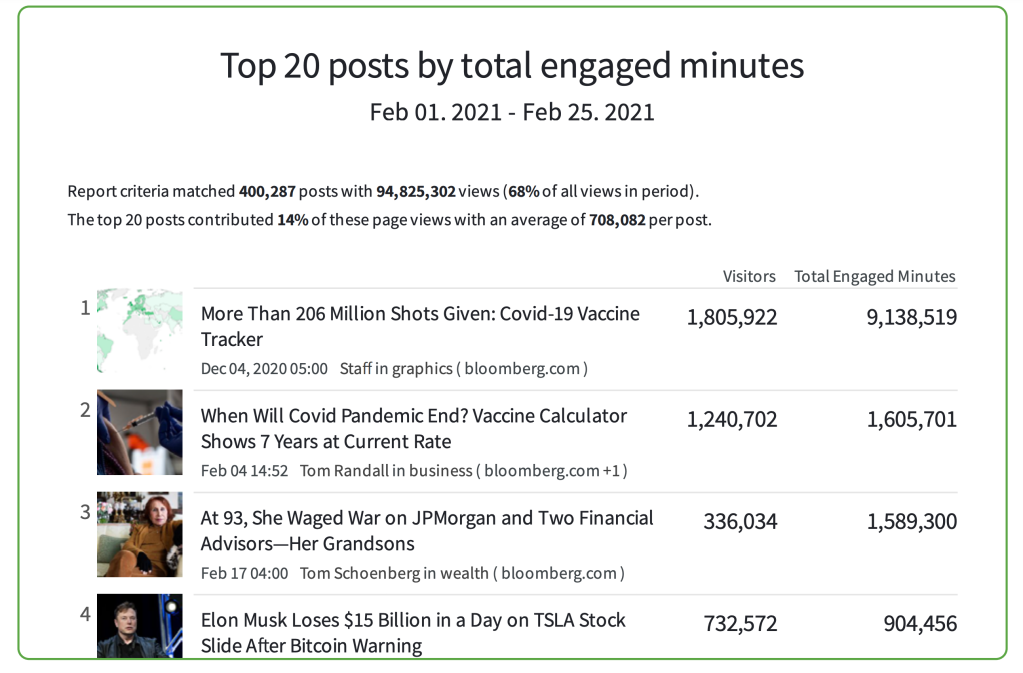
Top Listings/Posts Report
The top listings/posts report lets you stay on the pulse of your site’s top 20 posts. It also ranks the total engagement (in minutes) on posts over a specified time period. You can chart fluctuations month-over-month and suss out trends to determine what ranks highly — whether it’s specific site sections, authors, seasonality, or other factors.
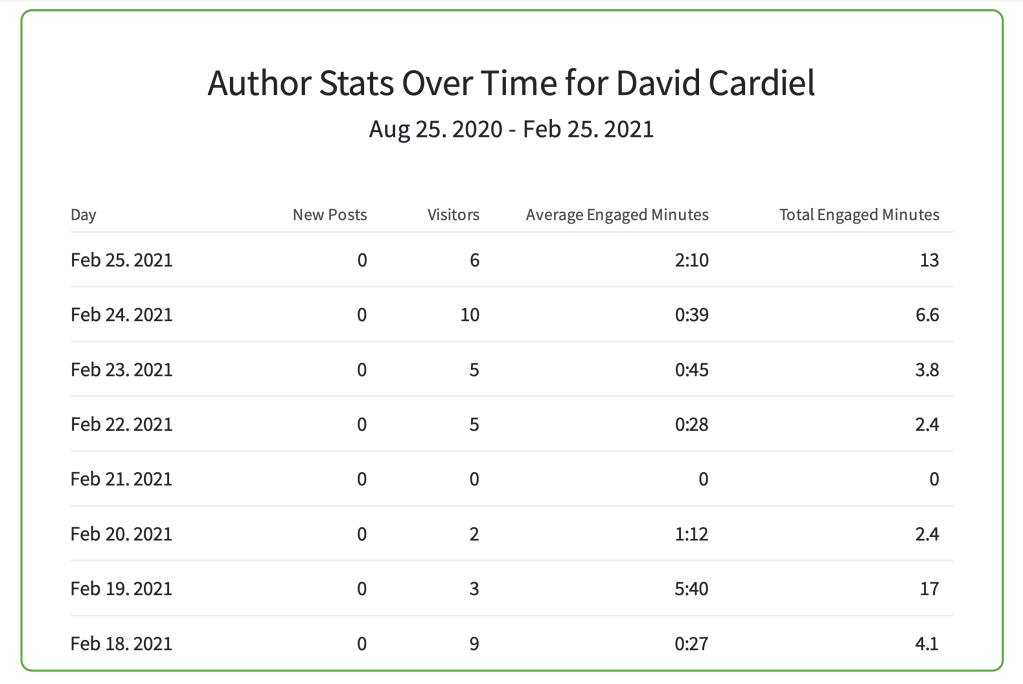
Stats Over Time Report
How many reports actually do the math for you? Dig into changes on a given categorization with the stats over time report. How does traffic change for a particular author, section, tag, or for the whole site? Which days/weeks are most impacted?
Other Metrics Available Through Parse.ly’s Dashboard