Results
- 8.5% more engaged time using Parse.ly’s Content Recommendation API
- 50% of Slate’s total headcount use the Parse.ly Dashboard
- 56 reports downloaded per month
- 35,000 paid Slate Plus memberships
Slate’s north star metric: How Slate used engaged time to increase reader loyalty and grow subscriptions
Slate launched Slate Plus, a membership program that allowed the decades-old online magazine to lower their dependence on platforms and monetize their incredibly loyal audience. “The Facebook algorithm and referral traffic can be very fickle and not always controllable,” said Anna Gilbert, Director of Research at Slate. Within 3 years, Slate Plus grew to over 35,000 members and continues to be a core part of the business model.
To grow their most loyal audience, Slate needed to align everyone in their organization on the new goal of fostering intense engagement, instead of reach. How? By gradually replacing unique visitors with a new way to measure loyalty: the amount of time a visitor actively reads or watches a piece of content.
“Our deliberate shift in strategy stems from our belief that the engaged time goal uniquely aligns the priorities of readers, advertisers, and our editorial team.”
David Stern, Director of Product Development, Slate
“Our deliberate shift in strategy stems from our belief that the engaged time goal uniquely aligns the priorities of readers, advertisers, and our editorial team. If readers spend more time with content that they value, they’ll be more likely to view more ads while they’re reading, they’ll be more likely to share our content, and they’ll be more likely to join our membership program, Slate Plus,” said David Stern, Slate’s Director of Product Development.
Slate implemented their new “North Star metric” team by team. At every step of the way, Parse.ly provided access to audience data that helped Slate’s product managers, journalists, and analysts understand how to move the needle forward on engaged time.
How do you track loyalty?
“Engaged time was just a good metric to capture how people are flowing through the funnel, and at each stage. Whether they’re first time visitors or every day visitors, are they staying on Slate longer?”
Anna Gilbert, Director of Research, Slate
When Slate shifted toward loyalty, the first question was “How are we going to track this?” There were a variety of metrics on the table. They considered returning visitors and number of visits, but finally settled on engaged time.
“It’s just a great way to measure the sincerity of first time visitors,” says Anna Gilbert, Slate’s Director of Research. “If we have first time visitors that come to Slate and read two or three articles and spend a minute and a half or two minutes, we want that to be reported and credited in this loyalty initiative. And we think that those every day visitors, or those twice a week visitors are also captured really well.”
How do you transform casual readers into loyal fans?
Read up on 4 different ways WordPress VIP and Parse.ly help publishers deliver data-driven content experiences that captivate and retain audiences.
Product team + Parse.ly’s API: Create an engaging user experience with relevant content suggestions
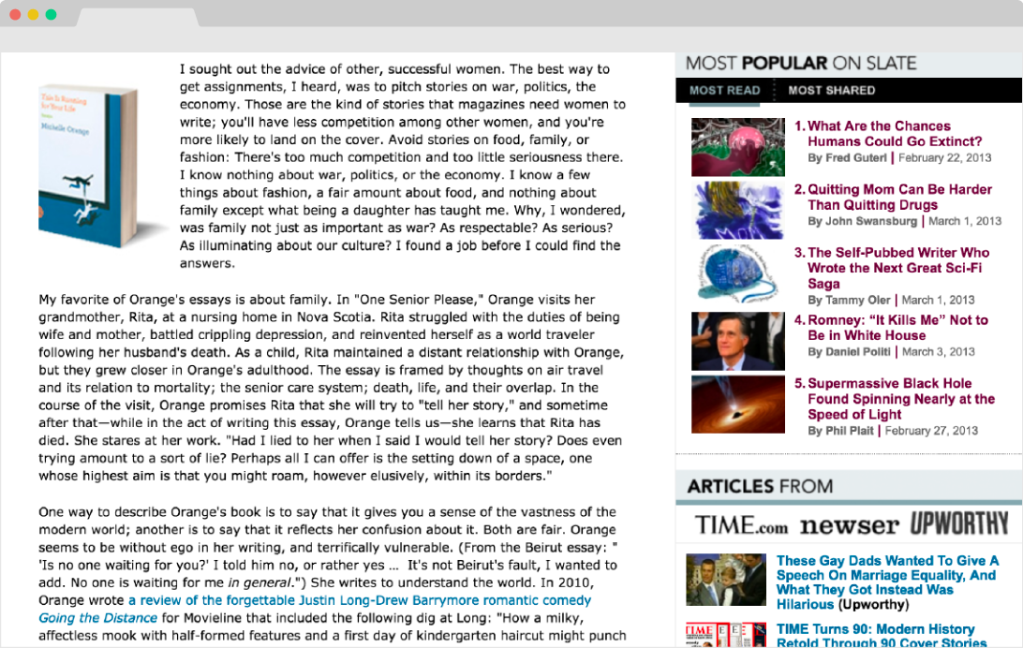
Slate’s first step toward increasing engaged time came with a redesign of the readership experience. Director of Product Development David Stern and his team wanted to eliminate two “usability sins” in the product’s design: lists of recirculation links crammed in next to every article and pagination after 1,000 words. To move forward, they needed to find a replacement. Pagination alone was responsible for 10% of Slate’s page views and ad impressions.
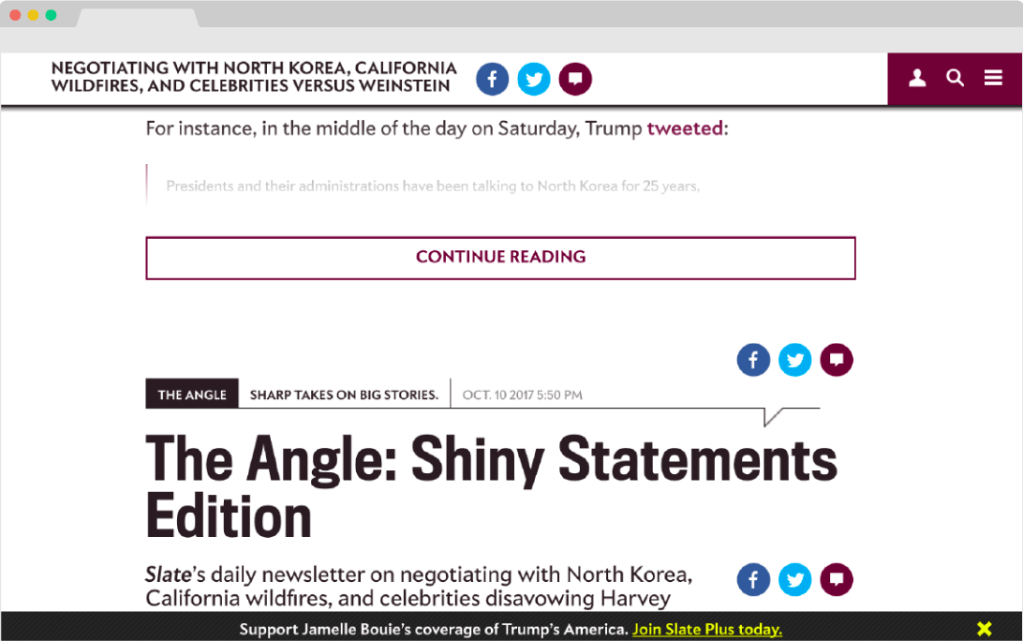
The ultimate solution? Personalized content recommendations and thoughtful product design. Slate brought these together in an infinite scroll reading experience. When a reader reaches the bottom of one Slate story, another relevant story appears. The next story is selected by Parse.ly’s recommended content API, which semantically analyzes the content of the current story and finds other recent stories that cover similar topics.
One year after Slate rolled out infinite scroll, engaged time per visitor increased by 8.5% and 17% of total page views occurred on scrolled articles. “The Parse.ly algorithm was pivotal for us to be able to do this,” said Anna Gilbert, Slate’s Director of Research.
The goal of increasing engaged time guided the entire development process. Stern stated, “With engaged time at the forefront of our minds as we developed our infinite scroll implementation, we were able to avoid the trap of pitting user experience and revenue against each other.”
“The Parse.ly algorithm was pivotal for us to be able to do this.”
Anna Gilbert, Director of Research, Slate
Request a demo
Want to increase audience engagement and time on site? See how Parse.ly’s personalized content recommendation API will keep your readers coming back for more.
Editorial team + Parse.ly’s Dashboard: Lead editorial’s engagement efforts with a north star metric
Editorial has the most direct path to engaging an audience. If writers and editors don’t buy into a strategy change, the strategy will never take hold. Before there was any inkling that engaged time would become their core KPI, editorial monitored concurrents in Chartbeat. However, seeing how many people are on the site or page right now wouldn’t help the team develop a long-term strategy.
Parse.ly’s dashboard allowed the editorial team to slice the data in different ways: they could see a variety of metrics—like engaged time, returning visitors, and social interactions—over the past year or up to the last five minutes, for a specific author, section, or topic.
“The interactivity of Parse.ly’s dashboard helps writers and editors—people who don’t dive into Excel spreadsheets every day—find answers to their top questions,” said Gilbert. “Parse.ly gives people what they’re looking for in a way that’s not overwhelming, but it’s still a source for answering complex questions.”
When a reporter filters traffic by unique visitors or page views, minutes per visitor is always shown. This ever-present context made the switch from unique views to engaged time as simple as one click. “Seeing engaged time in the dashboard helped us make a much smoother transition from unique visitors and the Big Bang Facebook days to a more real relationship with our most loyal readers,” said Gilbert.
A dashboard for everyone
Editorial isn’t the only team looking at the Parse.ly dashboard. The sales team uses metrics in Parse.ly to tell stories when they’re pitching prospects. The product team watches traffic closely to understand user behavior and generate ideas for experiments to improve experience.
Gilbert said the whole company checks the dashboard to see what’s trending each day: “A number of people are using the Parse.ly dashboard as their own version of a homepage.”
Analytics team + Parse.ly’s Data Pipeline: Empower analysts to find deeper audience insights with flexible, raw data
Parse.ly’s API and dashboard helped Slate’s product and editorial teams engage their existing audience. The data team wanted to use audience data to answer critical business questions, but their bandwidth was eaten up by maintaining their legacy system’s FTP server to line-level data dumps. With access to their raw audience data through Parse.ly’s data pipeline, the team is figuring out how to engage audiences they don’t have yet.
A geographic analysis of visitors revealed “the most Slatey place in the United States” and prompted editorial to develop strategies for reaching audiences in places where Slate isn’t quite clicking.
Another initiative is aimed at identifying factors—like referral traffic or publication time—that correlate with a high amount of engaged time. Gilbert said, “It’s starting to answer our question of what are some good levers behind engaged time as a metric.” Her team is also using their audience data to understand how engaged time impacts the bottom line: “So many revenue numbers have been framed around page views. We’re working to pivot our reporting to uncover a clearer relationship between engaged time and revenue making.”
None of this deeper analysis would have been possible with Slate’s previous analytics provider. The data team struggled to simply keep a customized daily report up-to-date. “It was an old system, and the report was old, and then the event scripts were old,” said Gilbert.
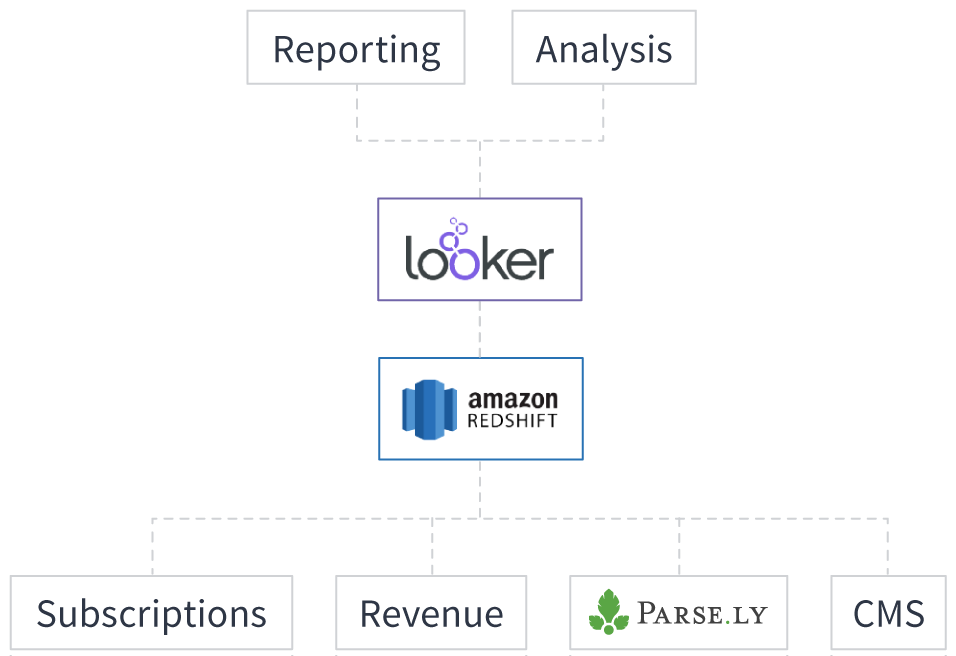
Now, Slate doesn’t have to choose between reporting and ad-hoc analysis. They can do both. They analyze and build reports on top of their audience data in Looker, a business intelligence tool, which automatically sends editorial a daily report showing yesterday’s engaged time stacked up against their goals.
Request a demo
Get even deeper analysis with Parse.ly’s Data Pipeline. Get in touch to learn about the type of data you can access and its many use cases.
What’s next?
Gilbert has ambitions to build a robust collection of reports covering traffic by source, section, and writer: “I think getting Parse.ly data in Looker will increase the usage organizationally and democratize the data. At organizations where you have really inquisitive journalists, the more data you can get into more people’s hands in a way that is click and point friendly, the more people will be able to learn from it and have new and different questions.”
Help every team drive toward the same goal
By introducing engaged time team-by-team, Slate gave their new loyalty initiative time to prove itself as a viable path to revenue. Now that everyone at Slate is aligned on engaged time as their core KPI and looks at one set of audience data, each team can contribute to forming real relationships with Slate’s readers.
Need more proof?
Savage Ventures increased content production by 79% and grew traffic by 121% by centralizing their content management and streamlining operations with WordPress VIP and Parse.ly.