What Readers Are Reading: Introducing Parse.ly’s Midterms 2026 Page
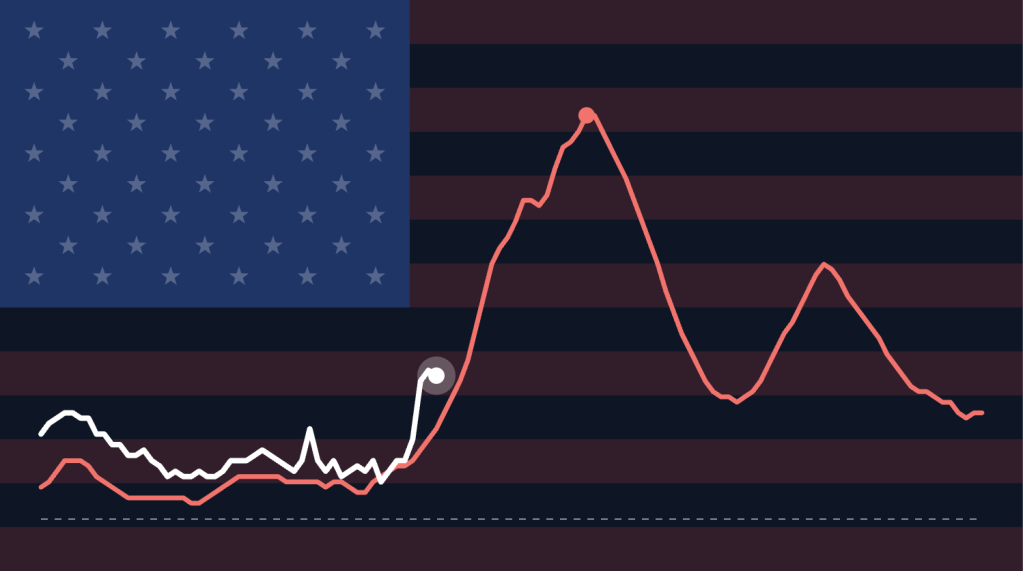
Parse.ly is an analytics product; how could we miss out on one of the highest-traffic nights for our media customers? Spoiler: we couldn’t.
With the midterms happening today, we wanted to see what was going on, and not just on a few sites- across our entire network of data. Once we did and started playing with it, we figured others might be interested in it as well, so we put together a public page that shows what readers across our network are actually reading about.
The page covers the attention Senate and governor races, 40 House races, and ballot measures in 39 states have gathered over the past week. We’ve defined “read” as one view of an article about a race or measure. It updates every hour, and will bump up to every few minutes tonight. That said, it’ll always be at least 15 minutes behind, so keep that in mind as you read through.
One thing we want to make sure is really clear up front: this is only reading data. There are no polls, no surveys, no odds, and no forecasts. If a lot of people are reading about a race, we’re showing they’re paying attention to it; that doesn’t mean it predicts who’s going to win. To be clear, the numbers show who people are reading about, not who they support.
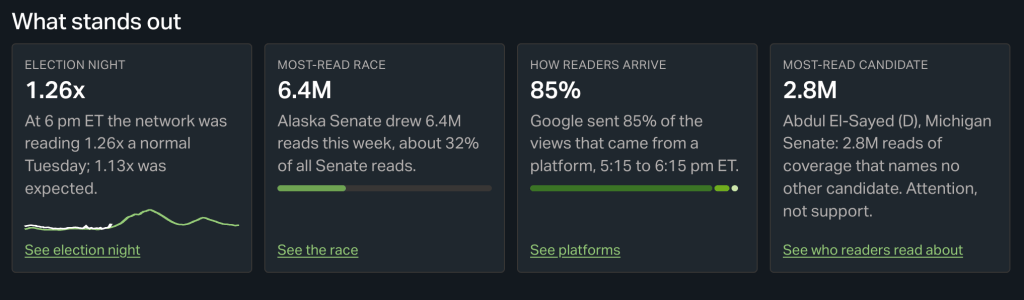
At the top you’ll see a few headline cards: tonight’s election night multiple (how tonight’s reading compares to a normal Tuesday), the most-read race, how much of the platform traffic Google is sending, and the most-read candidate.
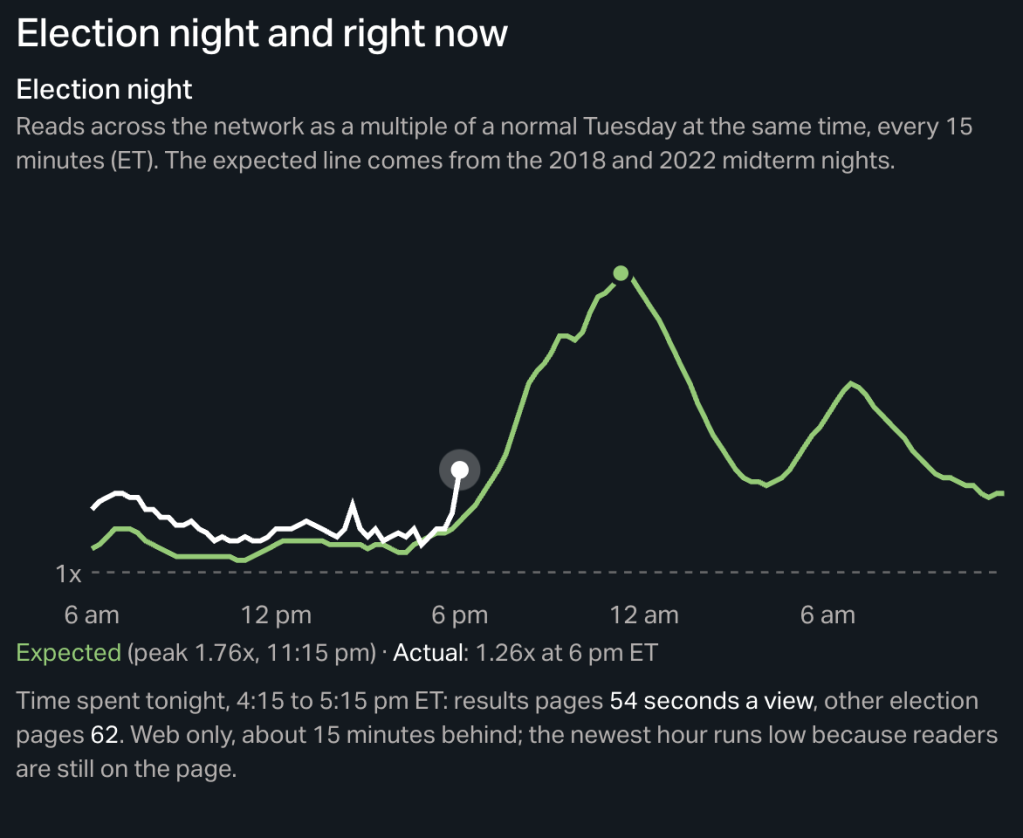
Right below that is the election night chart. We’re really excited about it. Like the homepage on the Parse.ly dashboard shows how your day is comparing to your last eight, this shows tonight’s reading plotted against the 2018 and 2022 midterm nights. On those nights, we saw the line peak around 11:15 pm Eastern at about 1.76 times a “normal” Tuesday. If tonight’s line runs above that, readers are reading more than on a typical midterm night, and if it runs below, they’re reading less.
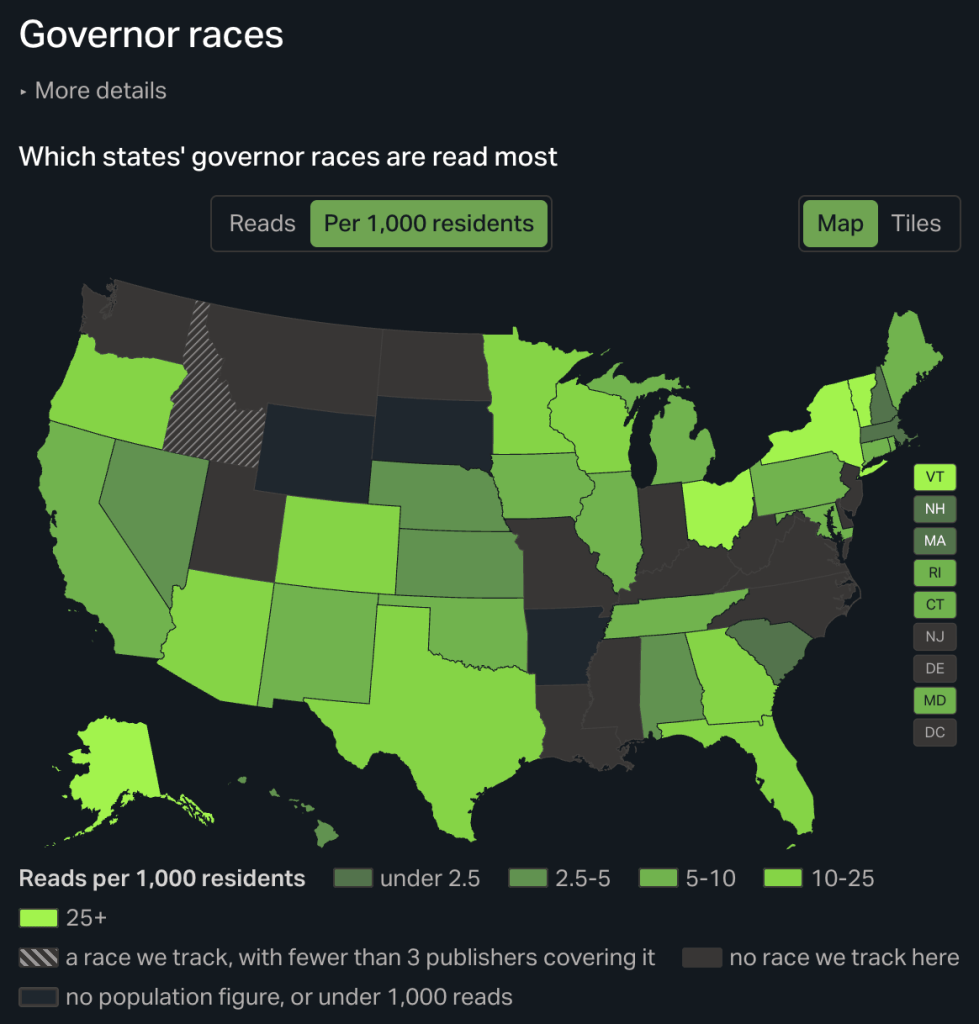
You’ll also see the most-read races in the last hour (expect it to look pretty different at 9 pm Eastern than at midnight). If you want to get a bit more involved, check out the state map, where you can switch between total reads, reads per 1,000 residents, and what’s moved this week (you can even replay the whole week to see how attention has shifted!). Keep in mind, we have more publishers in some states than others, so the per-resident view or a race’s share of its own state’s reads is the fairer way to compare.
We’ve defined “time spent” as the average number of seconds someone actually spends on a page about each race. We’re only counting web traffic, since Apple News and apps don’t really report it, but it’s the best way to tell if someone is just clicking (aka the headline is working) or actually reading the article.
You can also see what readers are using to get to the articles they’re engaging with: search, social, apps, Apple News, and direct. It’s interesting, as of right now (6:35 pm Eastern), direct traffic is leading the charge, which looks a little different from what we see day to day on a news site. It seems like people already know where they want to go for their election news tonight.
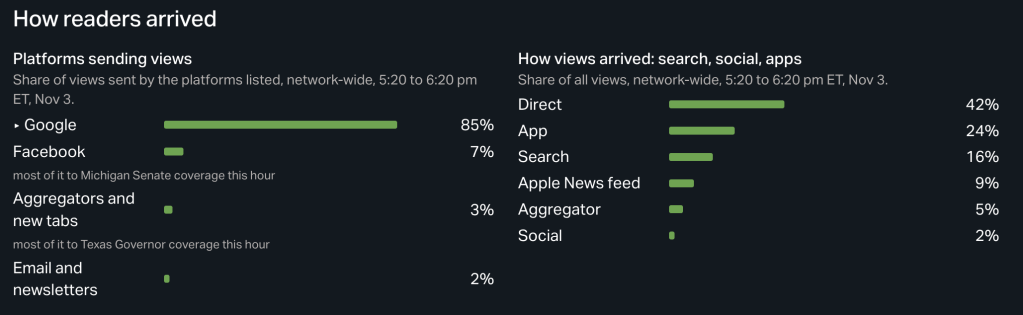
Now let’s get into the data. Every number has at least three publishers behind it, or it’s left out. Publishers who have chosen not to include their data in aggregate reporting are excluded before anything is counted, and no publisher is named anywhere on the page, so no single site’s audience is exposed. The full method is in “About the Data” on the page. It’s the same signal newsrooms see for their own stories inside the Parse.ly dashboard, just across the whole network. We wanted to make it public tonight for editors planning tomorrow’s coverage, audience and SEO teams tracking where traffic comes from, and, honestly, anyone who’s just curious.
Take a look and let us know what you think. What would you like to see next time? If you want this view for your own site every day, not just on election night, we’re happy to walk you through it.