Not all bounces are created equal: Replacing bounce rate with engagement rate

The data analyzed in this post is from our most recent Authority Report. For a closer look at the data, download the full Authority Report on redefining bounce rate with engaged time here.
Imagine a site visitor spends 15 seconds interacting with a piece of content, while another spends two minutes with the same article before leaving the site. Even though each visitor ostensibly had a different experience with the content, traditional web analytics qualify both these sessions as a “bounce.”
We can understand reader behavior on a single page more accurately by studying engagement rates across our digital media and news network.
Media organizations have made strides in contextualizing metrics, but “engagement” still proves nebulous—what’s good and what’s bad, and what do you do once you know? By studying engaged time rates in detail, we’re now able to come up with a better definition for “bad traffic” than bounce rate, and a better measurement than word count for “long- vs. short-form content.”
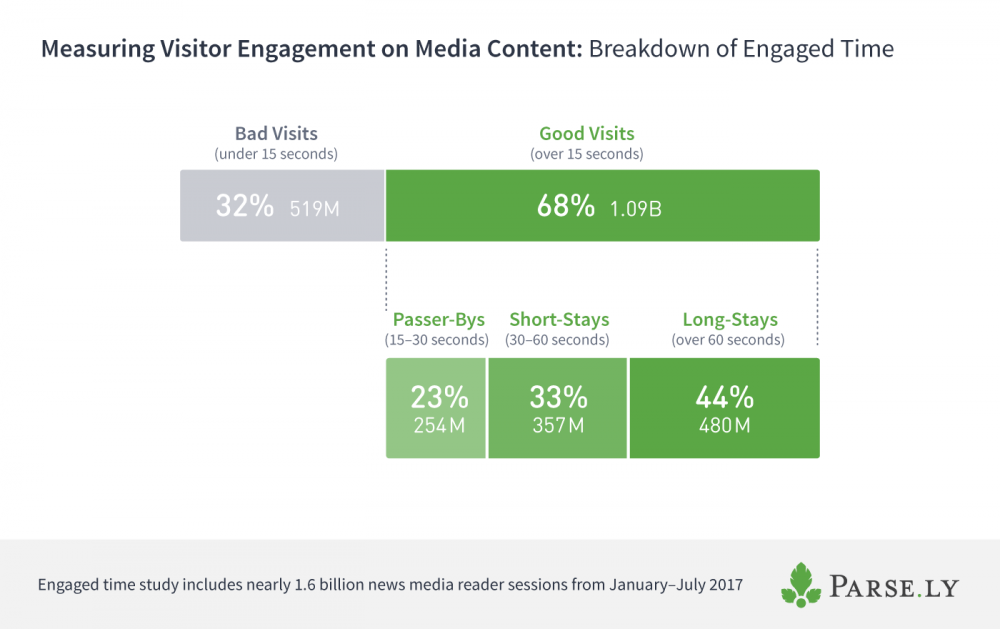
Parse.ly’s data insights team analyzed nearly 1.6 billion reader sessions over six months in order to get insights into engaged time breakdowns and drop-off rates for content. Using four different classifications of site visits with engaged time, we see far more “good” visits than “bad.”
Defining four types of site visits
Bounce rate ignores how visitors engage with content after they click, making its use problematic for understanding actual satisfaction of a user. While news and media sites don’t rely on the metric as much as they once did, the promise of seeing whether a number representing satisfied readers hasn’t been fulfilled by much else. To try to solve for this, we looked at user behavior on media content defined by the amount of time they spend with the content.
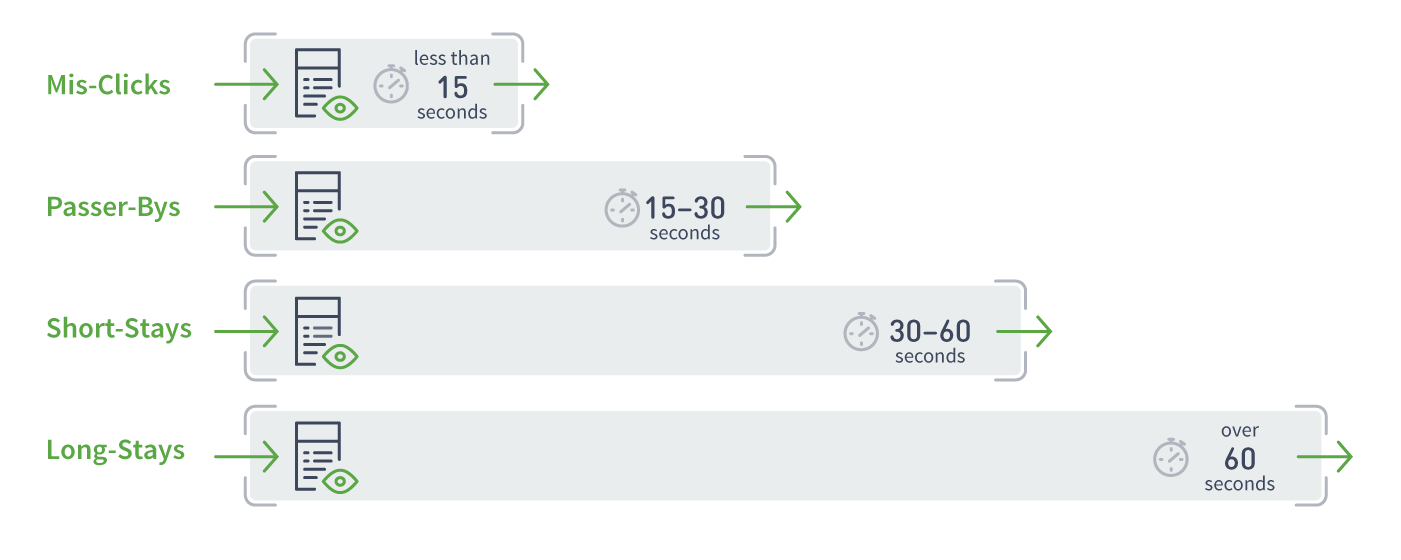
The four classifications of site visits are:
- Mis-Clicks: A site visit under 15 seconds long.
- Passer-Bys: A site visit 15 – 30 seconds long.
- Short-Stays: A site visit 30 – 60 seconds long.
- Long-Stays: A site visit over 60 seconds long.
All four types of visits described here would be considered “bounce” by traditional analytics tools. You can visualize each visit type below:

Of these, the two categories that one might rightly consider “bounce” are Mis-Clicks and Passer-Bys. In the case of Mis-Clicks, the equivalence with “bounce” is straightforward: if someone comes to your site and spends less than 15 seconds there, we can safely assume they didn’t actually mean to click on the site—or, if they did, they quickly regretted it. Sites of all kinds—including media companies—attempt to minimize the number of Mis-Clicks associated with their brand.
Passer-Bys are a more nuanced case. If a user spends 15-30 seconds on your site, they may not be completely satisfied by what they saw, but they also might be “grazing” or “skimming” your content. Some pieces of content deliver satisfaction quite quickly: think, an important news photograph where most visitors just came for a quick visual impression of the full-bleed photograph.
Short-Stays and Long-Stays are where you start to see traditional bounce rate truly fail you. These are, for all intents and purposes, very good visits. If a user spends 30-60 seconds reading your content, they are engaged. If they spend over a minute on your content, they are more engaged than most website visitors on any Internet content, according to our research. As a result, we should definitely not be treating these valuable visits as losses of any kind.

Read the full data research by downloading our recent Authority Report.
How engaged time can predict maximum engagement rates
The reason this kind of visitor analysis is not common for traditional web analytics is because there is a missing critical ingredient: engaged time.
Once you can measure engaged time, you can start to understand engagement rates for all content.
Engagement rates tend to cluster around certain levels depending on the piece of content. For example, a typical well-produced and well-distributed three-minute video has quite a few Short-Stay visits and quite a few Long-Stays, and even a few visitors that stay longer than three minutes. Using this visitor information, we would be able to determine that three minutes is essentially the maximum engagement rate for this piece of content.
Currently, the way many systems have tried to determine maximum engagement rates using the content itself. For example, Medium’s Total Time Read relies on word count, average human reading speed and some assumptions around images:
“Read time is based on the average reading speed of an adult (roughly 275 WPM). We take the total word count of a post and translate it into minutes. Then, we add 12 seconds for each inline image. Boom, read time.”
But for across various types of content, this can be tricky. For video embeds, some videos include metadata about duration, but the true duration may be modified by 30-second ad spots that roll inside the video. Much text content can be analyzed for its word count, but interactive features embedded in the content—or supporting diagrams and photographs—can lead to longer engaged times than the mere number of words indicates.
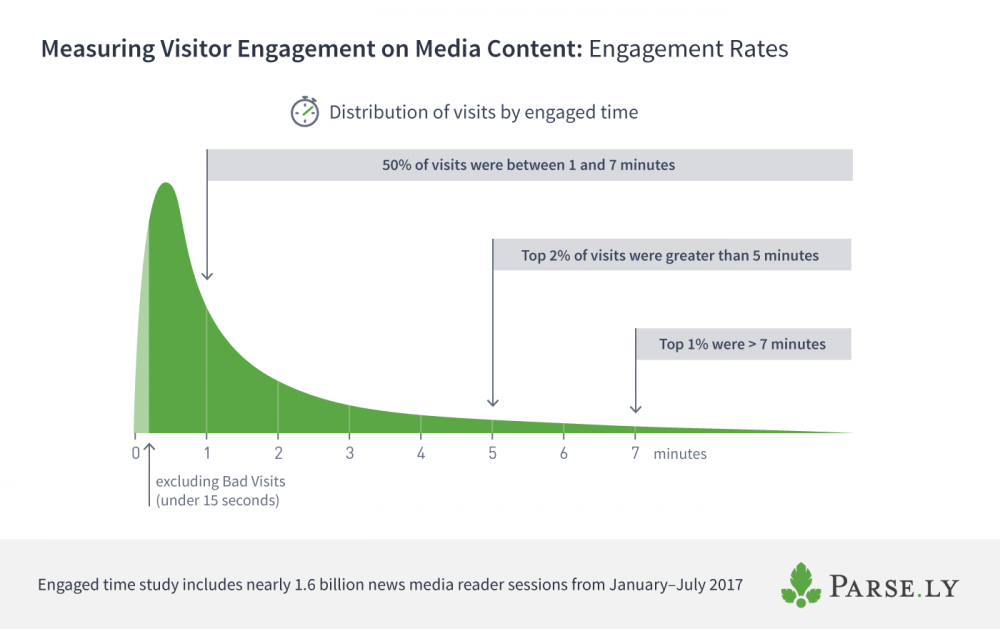
Given a piece of content that receives enough visitors, we can understand the “reasonable minimum” and “reasonable maximum” engagement rates by studying the engaged time distribution, without having to use unreliable content metadata.

The idea here is that we chop off the Mis-Clicks from our data set, and we use the median (rather than the average) to ensure that any strange data doesn’t skew the reasonable maximum. For example, some particularly clever bots may appear to be uber-engaged Long-Stay visitors, but as long as they are small in number, a human median will prevail.
Based on our analysis, the top 50% of sessions, after excluding Bad Visits, have between 1 and 7 minutes of engagement. The top 2% of these sessions have over 5 minutes of engaged time, and the top 1% have over 7 minutes.
We therefore have a reasonable definition of “engagement drop-off rate.” For a given post, the maximum reasonable Internet user engagement we can expect is 7 minutes; the reasonable minimum is around 15 seconds. This is true across all publisher content, as far as we can tell.
Renewing the focus on good visits
Bounce rate lumps together the good with the bad. Engaged time emphasizes what really matters: the good visits that indicate a satisfactory user experience.
What causes bad visits? We’re not entirely certain, but specific referring domains (like Reddit or Drudge) and specific user agent kinds (like bots) are among our suspected culprits. We also believe that sites with poorer page performance, more cluttered design, and/or a higher number of mobile/rural visitors (with slower data connections) may end up being punished with higher rates of Mis-Clicks and Passer-Bys. We’ll be doing more work here to dig in further and try to estimate how much of bad traffic is recoverable vs intrinsic to the current state of the web. More coming soon on this.
Understanding how engaged time for your content compares to the reasonable minimum and reasonable maximum engagement rates can give you a sense of the quality of visits on your site. As one of our analysts points out, benchmarking engaged time renews the focus on experience, not just traffic.
I am text block. Click edit button to change this text. Lorem ipsum dolor sit amet, consectetur adipiscing elit. Ut elit tellus, luctus nec ullamcorper mattis, pulvinar dapibus leo.