Kafkapocalypse: a postmortem on our service outage
Customer Impact
No data was lost. Despite the length of the service outage and disruption (several hours), Parse.ly has several layers of redundancy installed in its data collection process. This redundancy was not compromised and raw data continued to be collected through the outage period, and this data was successfully archived to our durable data store, Amazon S3. Data is now being restored to all customer accounts from that durable data store. The customer impact was therefore limited to:- temporary bad display of real-time data in the dashboard on Thursday night and Friday afternoon
inaccurate historical reports sent out on Monday morning (e.g. by email); data from Thursday night and Friday was missing a few hours
Both of these issues are being remedied by the data rebuilds our team is performing today and tomorrow.
NOTE: from this point on in this postmortem, the explanation will become tech-heavy, talking about the mechanics of the failure. This part is really technical, so if you don’t like that kind of writing, you should stop here!
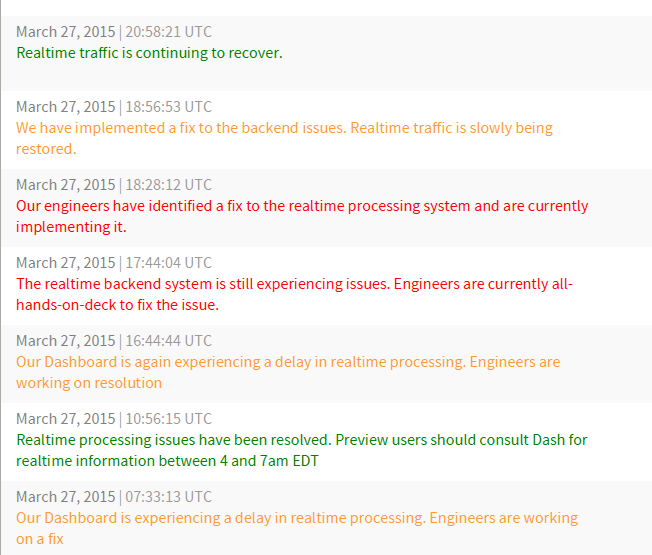 Throughout the outage, we updated our public status page, status.parsely.com, and our Twitter support account, @ParselySupport.
What Happened
For a few months now, Parse.ly has been running two production systems in parallel. One system is our “production dashboard”, at dash.parsely.com. This is powered by a backend that we built originally in 2012-2013 and incrementally improved from then. The second system is our “preview dashboard”, at preview.parsely.com. This was a re-architected backend, built and deployed in 2014 and released to select beta customers in early 2015. The new “preview dashboard” is powered by our new time series engine, Mage. Though “production” and “preview” are completely parallel systems, they are both powered by the same data source. They get their data from our JavaScript tracker, which sends thousands of requests per second into our data collection servers. These servers then forward their data to a distributed log/messaging system called Apache Kafka. The Kafka subsystem allows several downstream consumers to make use of this analytics data. In our case, consumers include the backend for our “production dashboard”, and the backend for our “preview dashboard”, along with other in-house monitoring systems. In nearly 2 years of running Apache Kafka in production, we have never had an issue with its reliability. It spreads its load automatically among several cloud nodes and handles enormous data volumes with grace and ease. We might have even taken the scalability of this part of our cluster for granted. It is critical to our log-oriented architecture. However, on Friday, our data volumes hit a threshold where our Kafka plant stopped working. The result of this was that our entire data processing pipeline stopped working, both the one that powers the “production dashboard”, and the new “preview dashboard”.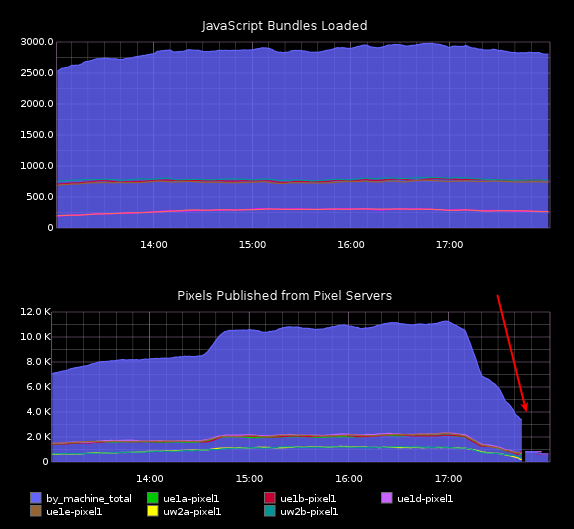 The Kafka outage begins; JavaScript code continues to load on customer sites, but analytics data is not flowing into our real-time processing stream.
Since Kafka is the core data source for all of Parse.ly’s systems, we dubbed this “Kafkapocalypse”. Its failure led to a number of cascading failures throughout our plant, which took our team some time to fully unwind.
The Kafka outage begins; JavaScript code continues to load on customer sites, but analytics data is not flowing into our real-time processing stream.
Since Kafka is the core data source for all of Parse.ly’s systems, we dubbed this “Kafkapocalypse”. Its failure led to a number of cascading failures throughout our plant, which took our team some time to fully unwind.
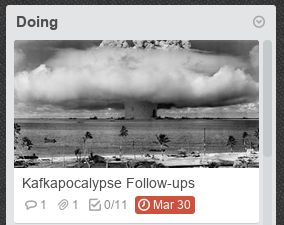 Trello card the team created with all the team follow-ups from the outage event.
What We Did Right
We knew the failure was happening because of widespread reports from monitoring tools like Munin, Sentry, and Pingdom. We saw graphs that could back up the failures in Graphite. Our 24/7 pager service, PagerDuty, had woken up our on-call engineer in the middle of the night when the first outages started happening. He came online and pulled in secondary support, who helped do a preliminary diagnosis, which was shared with the full engineering team as they were coming online around 8am ET. When the second failure happened just a few hours later, we immediately called a “war room” — brought all the engineers into a Google Hangout and talked through what we were seeing, and delegated specific sub-investigations to pairs of team members. We quickly came to consensus on a plan and a preliminary root failure analysis, while also confirming that customer data was intact. Throughout the day, the team stayed calm, cool, and collected. No finger-pointing or blame, just a level-headed exploration of the issues. We also had a new backend engineer on the team who was in his second week, and we joked with him that this was quite the introduction to Parse.ly, as he was seeing probably the worst cluster failure we had seen in 18 months. He probably learned a lot just by listening!Why Did Kafka Fail?
The truth is, Kafka did not really fail. Instead, what failed were all the nodes that Kafka was running on. Kafka is a fast system that allows us to route data throughout our plant. It therefore ends up being heavily network-loaded. Though we generally pay attention to network load on machines, we were paying closer attention to CPU and disk latency for Kafka over time. These were well in-check, but without us realizing it, outbound traffic on the NICs for these machines was growing by leaps and bounds.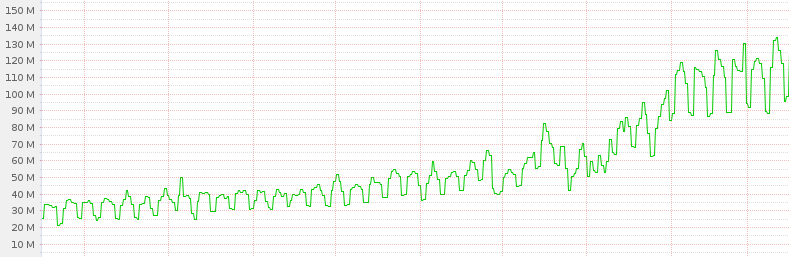 This munin graph shows the network utilization of a typical Kafka node creeping up over time. Given enough thimbles of water, you still have a tsunami.
This makes some logical sense. Not only had we recently been growing our data due to new customer growth, but we were also running two parallel plants off a single data source. In an effort to have a more disciplined development process, we also started the practice of having several parallel plants, such as “beta”, “staging”, and “production”, all working with partial or full firehoses of data.
So, though we were writing only 20 Mbps to our Kafka brokers, we were reading over 250 Mbps sustained bandwidth out of the same brokers. And this network load was peaking higher with traffic spikes across the Parse.ly network.
You can probably guess where this is going. Kafka is so efficient about its resource disk and CPU consumption, that we were running Kafka brokers on relatively modest Amazon EC2 nodes that did not have particularly high network capabilities. At some point, we were hitting operating system network limits and the brokers would simply become unavailable. These limits were probably enforced by Linux, Amazon’s Xen hypervisor, the host machine’s network hardware, or some combination.
The real problem here isn’t failure, but correlated cluster-wide failure. Because we were close to network limits on all of our Kafka nodes, when one failed, the remaining nodes would have to serve more consumers, which would, in turn, lead to more network traffic on those remaining nodes. It was a classic Cascading Failure.
Since these nodes are all identical, the failure of one node at peak capacity basically meant the failure of the entire cluster of nodes, in a cascading fashion. The firehose of data is relentless in this way!
This munin graph shows the network utilization of a typical Kafka node creeping up over time. Given enough thimbles of water, you still have a tsunami.
This makes some logical sense. Not only had we recently been growing our data due to new customer growth, but we were also running two parallel plants off a single data source. In an effort to have a more disciplined development process, we also started the practice of having several parallel plants, such as “beta”, “staging”, and “production”, all working with partial or full firehoses of data.
So, though we were writing only 20 Mbps to our Kafka brokers, we were reading over 250 Mbps sustained bandwidth out of the same brokers. And this network load was peaking higher with traffic spikes across the Parse.ly network.
You can probably guess where this is going. Kafka is so efficient about its resource disk and CPU consumption, that we were running Kafka brokers on relatively modest Amazon EC2 nodes that did not have particularly high network capabilities. At some point, we were hitting operating system network limits and the brokers would simply become unavailable. These limits were probably enforced by Linux, Amazon’s Xen hypervisor, the host machine’s network hardware, or some combination.
The real problem here isn’t failure, but correlated cluster-wide failure. Because we were close to network limits on all of our Kafka nodes, when one failed, the remaining nodes would have to serve more consumers, which would, in turn, lead to more network traffic on those remaining nodes. It was a classic Cascading Failure.
Since these nodes are all identical, the failure of one node at peak capacity basically meant the failure of the entire cluster of nodes, in a cascading fashion. The firehose of data is relentless in this way!
Our Response
Once we knew what was going on, the solution seemed simple enough: expand our Kafka cluster. This wasn’t that simple, though. Parse.ly is an early adopter of Apache Kafka and we are, ourselves, working on an improved Kafka client library for Python, called pykafka. Our production plant uses an earlier version of this client library, and an earlier version of Kafka, 0.7.2. (For context, Kafka 0.8.x only stabilized recently, and we had done our latest full Kafka deployment in early 2014.) Though our Python client library implemented broker auto-discovery and consumer group management via Zookeeper (what the Kafka team refers to as the “thick client” or “high-level” API), we weren’t sure how gracefully it would handle a dynamic cluster expansion. The newer versions of Kafka also had more monitoring tools for determining the state of topic replication and for doing things like rebalancing topics onto newly-available brokers, tools that were unavailable to us.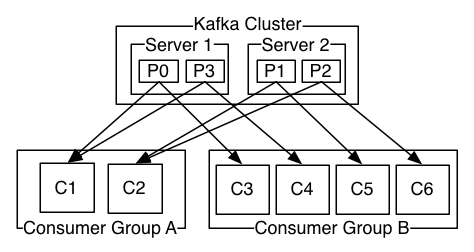 An illustration of consumer groups in Kafka.
We were reasonably confident that adding a few more nodes to the cluster would be handled gracefully, and result in new data being written to new partitions on the new brokers, even while old data would still have to be read from the existing brokers (since no rebalancing behavior exists in Kafka 0.7.2). So we went ahead and did this.
An illustration of consumer groups in Kafka.
We were reasonably confident that adding a few more nodes to the cluster would be handled gracefully, and result in new data being written to new partitions on the new brokers, even while old data would still have to be read from the existing brokers (since no rebalancing behavior exists in Kafka 0.7.2). So we went ahead and did this.
Heisencrash
To our surprise, when new Kafka brokers joined our network, several of our Kafka writing subsystems (called the “pixel publishers”) crashed across our cluster, with network host resolution errors. This then took down data processing altogether cluster-wide. By investigating our working system and attempting to fix a bug that was causing ephemeral failure, we managed to crash the entire cluster fully. Agh! The cause of this new failure was actually a bug in our configuration management system. Building new Kafka nodes is an automated step handled by an open source tool, Opscode Chef. But our recipe for building these nodes had a race condition where the new node was bootstrapped with the wrong host name. The end result was that several Kafka brokers joined our Kafka cluster, but mis-reported their own host name. These bad hostnames entered our Zookeeper cluster state, and caused our thick clients to attempt connections to hosts that didn’t actually exist. This confused the clients into thinking that the Kafka cluster was unavailable, resulting in all data processing being stopped in its tracks. We eventually figured this out and managed to get the right config populated Kafka, and the new nodes deployed to the cluster. At that point, we saw the network utilization drop, on a per-node basis, while data processing resumed. This was a good sign. We slowly flipped on all downstream consumer systems. Thankfully, our use of Apache Storm made this relatively painless. But by that point, we were already offline for about 3 hours and had to re-process a massive backlog of data. Storm’s useful “spout” and “topology” model for live data processing clusters made it easy for us to flip on and off consumers of Kafka data slowly to verify the system was coming back online appropriately. Tracking Kafka consumer offsets let us estimate how much lag we still had behind the real-time stream.
What We Learned
Our team took away several lessons from this. First, no system is immune to failure, especially when you consider host and operating system limits. We already knew this, but this was an excellent illustration, in the style of Murphy’s Law. Second, though CPU and disk I/O are good proxies for machine health, creeping network utilization can have a more pernicious effect, and is harder to monitor. You know if a node is at 80% of CPU, that things are going to get bad at 100%. But “100% of network utilization” is ill-defined on most nodes — it typically depends on a mix of factors, especially in cloud environments where VMs are multi-tenant on underlying host machines. Third, we are very thankful that our core raw data archival mechanism relies upon extremely simple mechanisms, such as web server logs, flat files, and Amazon S3 uploads. The fact that this data archival process is completely decoupled from our real-time processing stream (with Kafka) means that even while we were stressed by the firefight and rushing to get customers back online, we were not worried about permanent data loss, which would have been a much bigger stressor. This was a big vindication of the simplicity of the log-oriented architecture, where, as we’ve written before:A software application’s database is better thought of as a series of time-ordered immutable facts collected since that system was born, instead of as a current snapshot of all data records as of right now.Thankfully, since we had that series of time-ordered immutable facts in simple, archivable files, we never had any threat of data loss from this outage. Finally, a core lesson we learned is to think harder about “cascading failure” scenarios. That is, not situations where one or two machines in a cluster go offline, but scenarios where an entire subsystem goes offline fully, leaving downstream systems helpless.
 Overall, this outage, though stressful at the time, will make our production plant even stronger. I’m looking forward to scaling for the next trillion data points.
Special thanks to our customers for patience with us through this outage, and to our engineering team, who put in some serious heroic efforts and long hours to make sure the plant was back up-and-running smoothly.
Interested in helping us solve issues like this once and for all? We’re hiring — check out our job posting for software engineers for more information, and be sure to mention this post!
Overall, this outage, though stressful at the time, will make our production plant even stronger. I’m looking forward to scaling for the next trillion data points.
Special thanks to our customers for patience with us through this outage, and to our engineering team, who put in some serious heroic efforts and long hours to make sure the plant was back up-and-running smoothly.
Interested in helping us solve issues like this once and for all? We’re hiring — check out our job posting for software engineers for more information, and be sure to mention this post!