The Parse.ly Dashboard
The Parse.ly Dashboard is the heart of the platform, offering unmatched content analytics and insights about content performance. Users can access real-time or historical data in the dashboard and learn more about content performance via a number of aspects.
Navigating the Dashboard
Top Bar
At the top of the screen is the omnipresent top bar. This enables you to navigate through your Parse.ly network, see alerts, search, see saved views, and access your Account menu.

Nav Bar
The nav bar rests directly beneath the top bar and enables you to navigate the pages of the dashboard. Here, you can access the Overview, Posts, Authors, Sections, Tags, Referrers, Campaigns, Channels, Segments, Conversions, Reports, and Guide.

Overview and Fullscreen Views
On Overview, you can make quick decisions on what to promote based on what’s doing well. This screen shows off your top performing content in the past 10 minutes and holistically for the day.
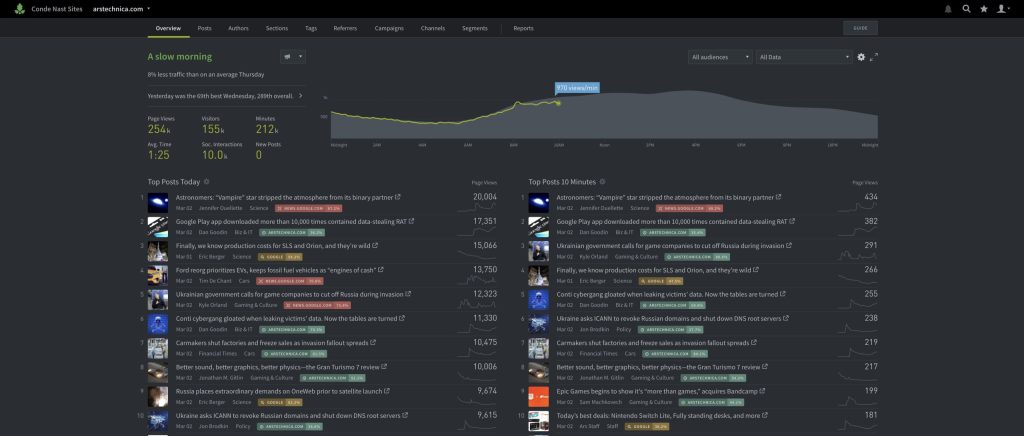
Click the top right expansion icon to make this fullscreen.
Most pages in Parse.ly can be made fullscreen. Put a page up on a TV for an exciting addition to your newsroom.
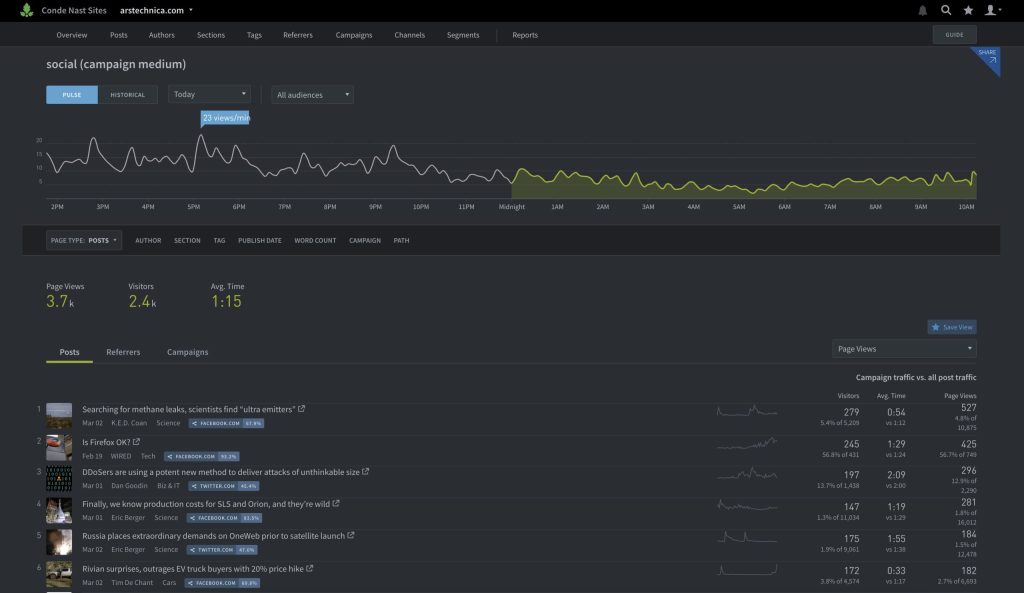
Top Posts Page
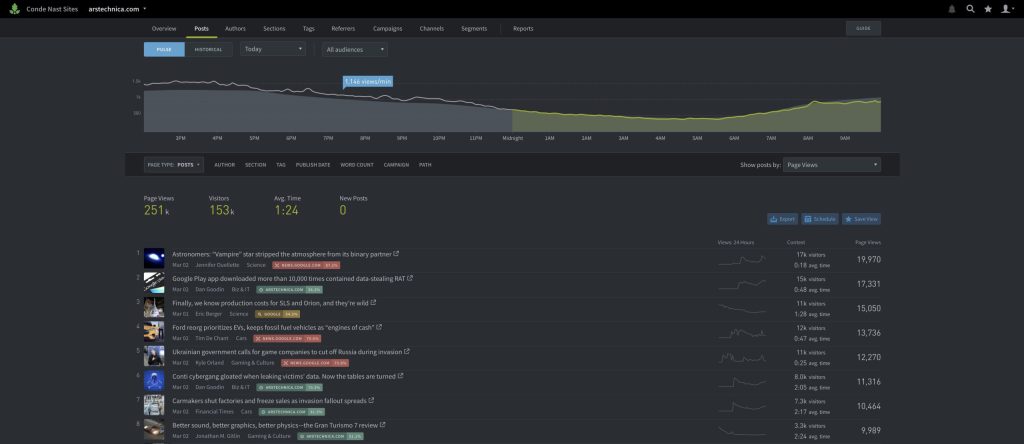
Customize your view of posts based on your measure of success. Sort by:
- Page views or visitors to see what people are clicking on.
- Engaged minutes to see what people are spending the most time reading.
- Shares, Likes, Tweets, & Pins to see what’s getting the most activity on social networks.
- Social referrers to see what stories people are clicking on from social networks.
Toggle easily between real time (pulse) and historical analysis. Why?
- It may be more relevant to see what’s done well in the past couple of hours when deciding what to promote.
- Looking back at top performing content in the last week or few weeks can help inform what you should write about moving forward. Is there a popular or developing story that needs more attention and follow up posts as more info comes out?
Use filters to find exactly what you’re looking for.
- Filter by Publish Date to see only articles published within the time period selected.
- If a particular author, section or tag may skew your data, use filters to exclude them from your results.
Post Details Pages
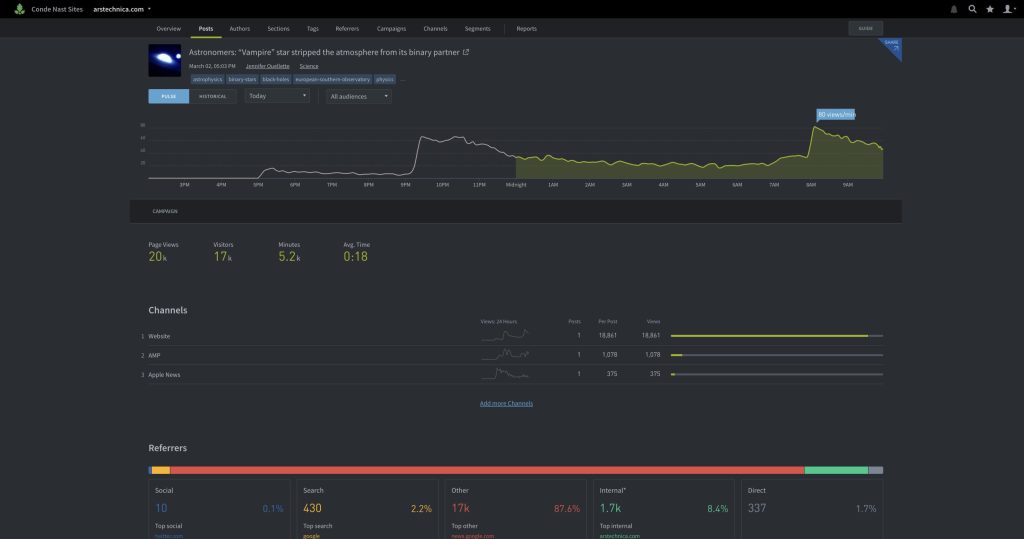
For more granular information on a specific post, simply click the headline on the post listings screen. On the post detail page, you can see high-level metrics on a post over any time period and see where your audience came from in the referrer section. Some referrers provide additional information if you click on them. For example, click on Twitter.com in the “Social” referrer bucket to see the specific tweets driving people to your site and to help identify social influencers.
Understand the complete reader path by looking at the “Activity After Viewing Post” section at the bottom of the page.
- Have linking strategies in place? This is your scorecard to see if people are clicking on what you want them to.
- Using our API to power recommended content? Make adjustments to the parameters of API calls to test what yields the highest “Clicks to Other Posts” percentage.
Top Authors Page
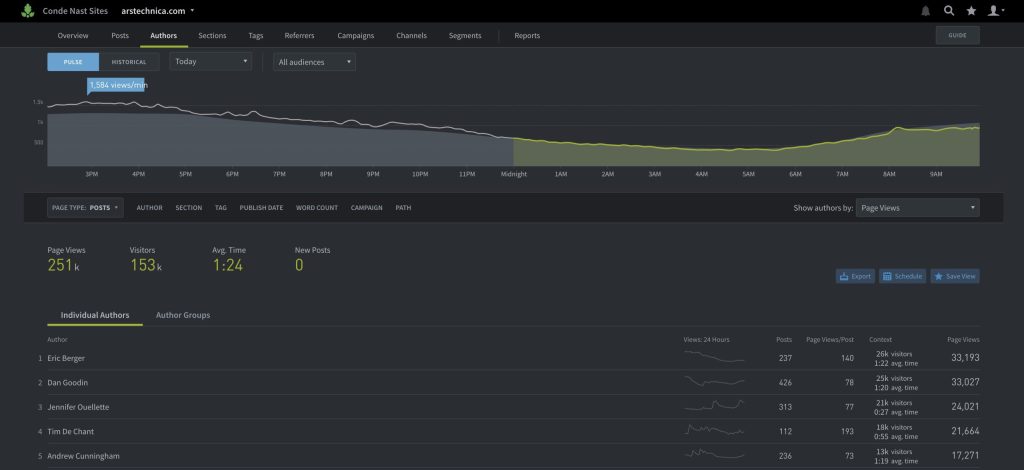
Just like in the post listings page, you can select a window of analysis, add filters, view the page in fullscreen mode, and even export the data to a spreadsheet with the click of a button. This page shows you how authors stack up to one another over any period. Use it as a motivational tool and fuel writers desire to break into the top 10! You can also view author groups here.
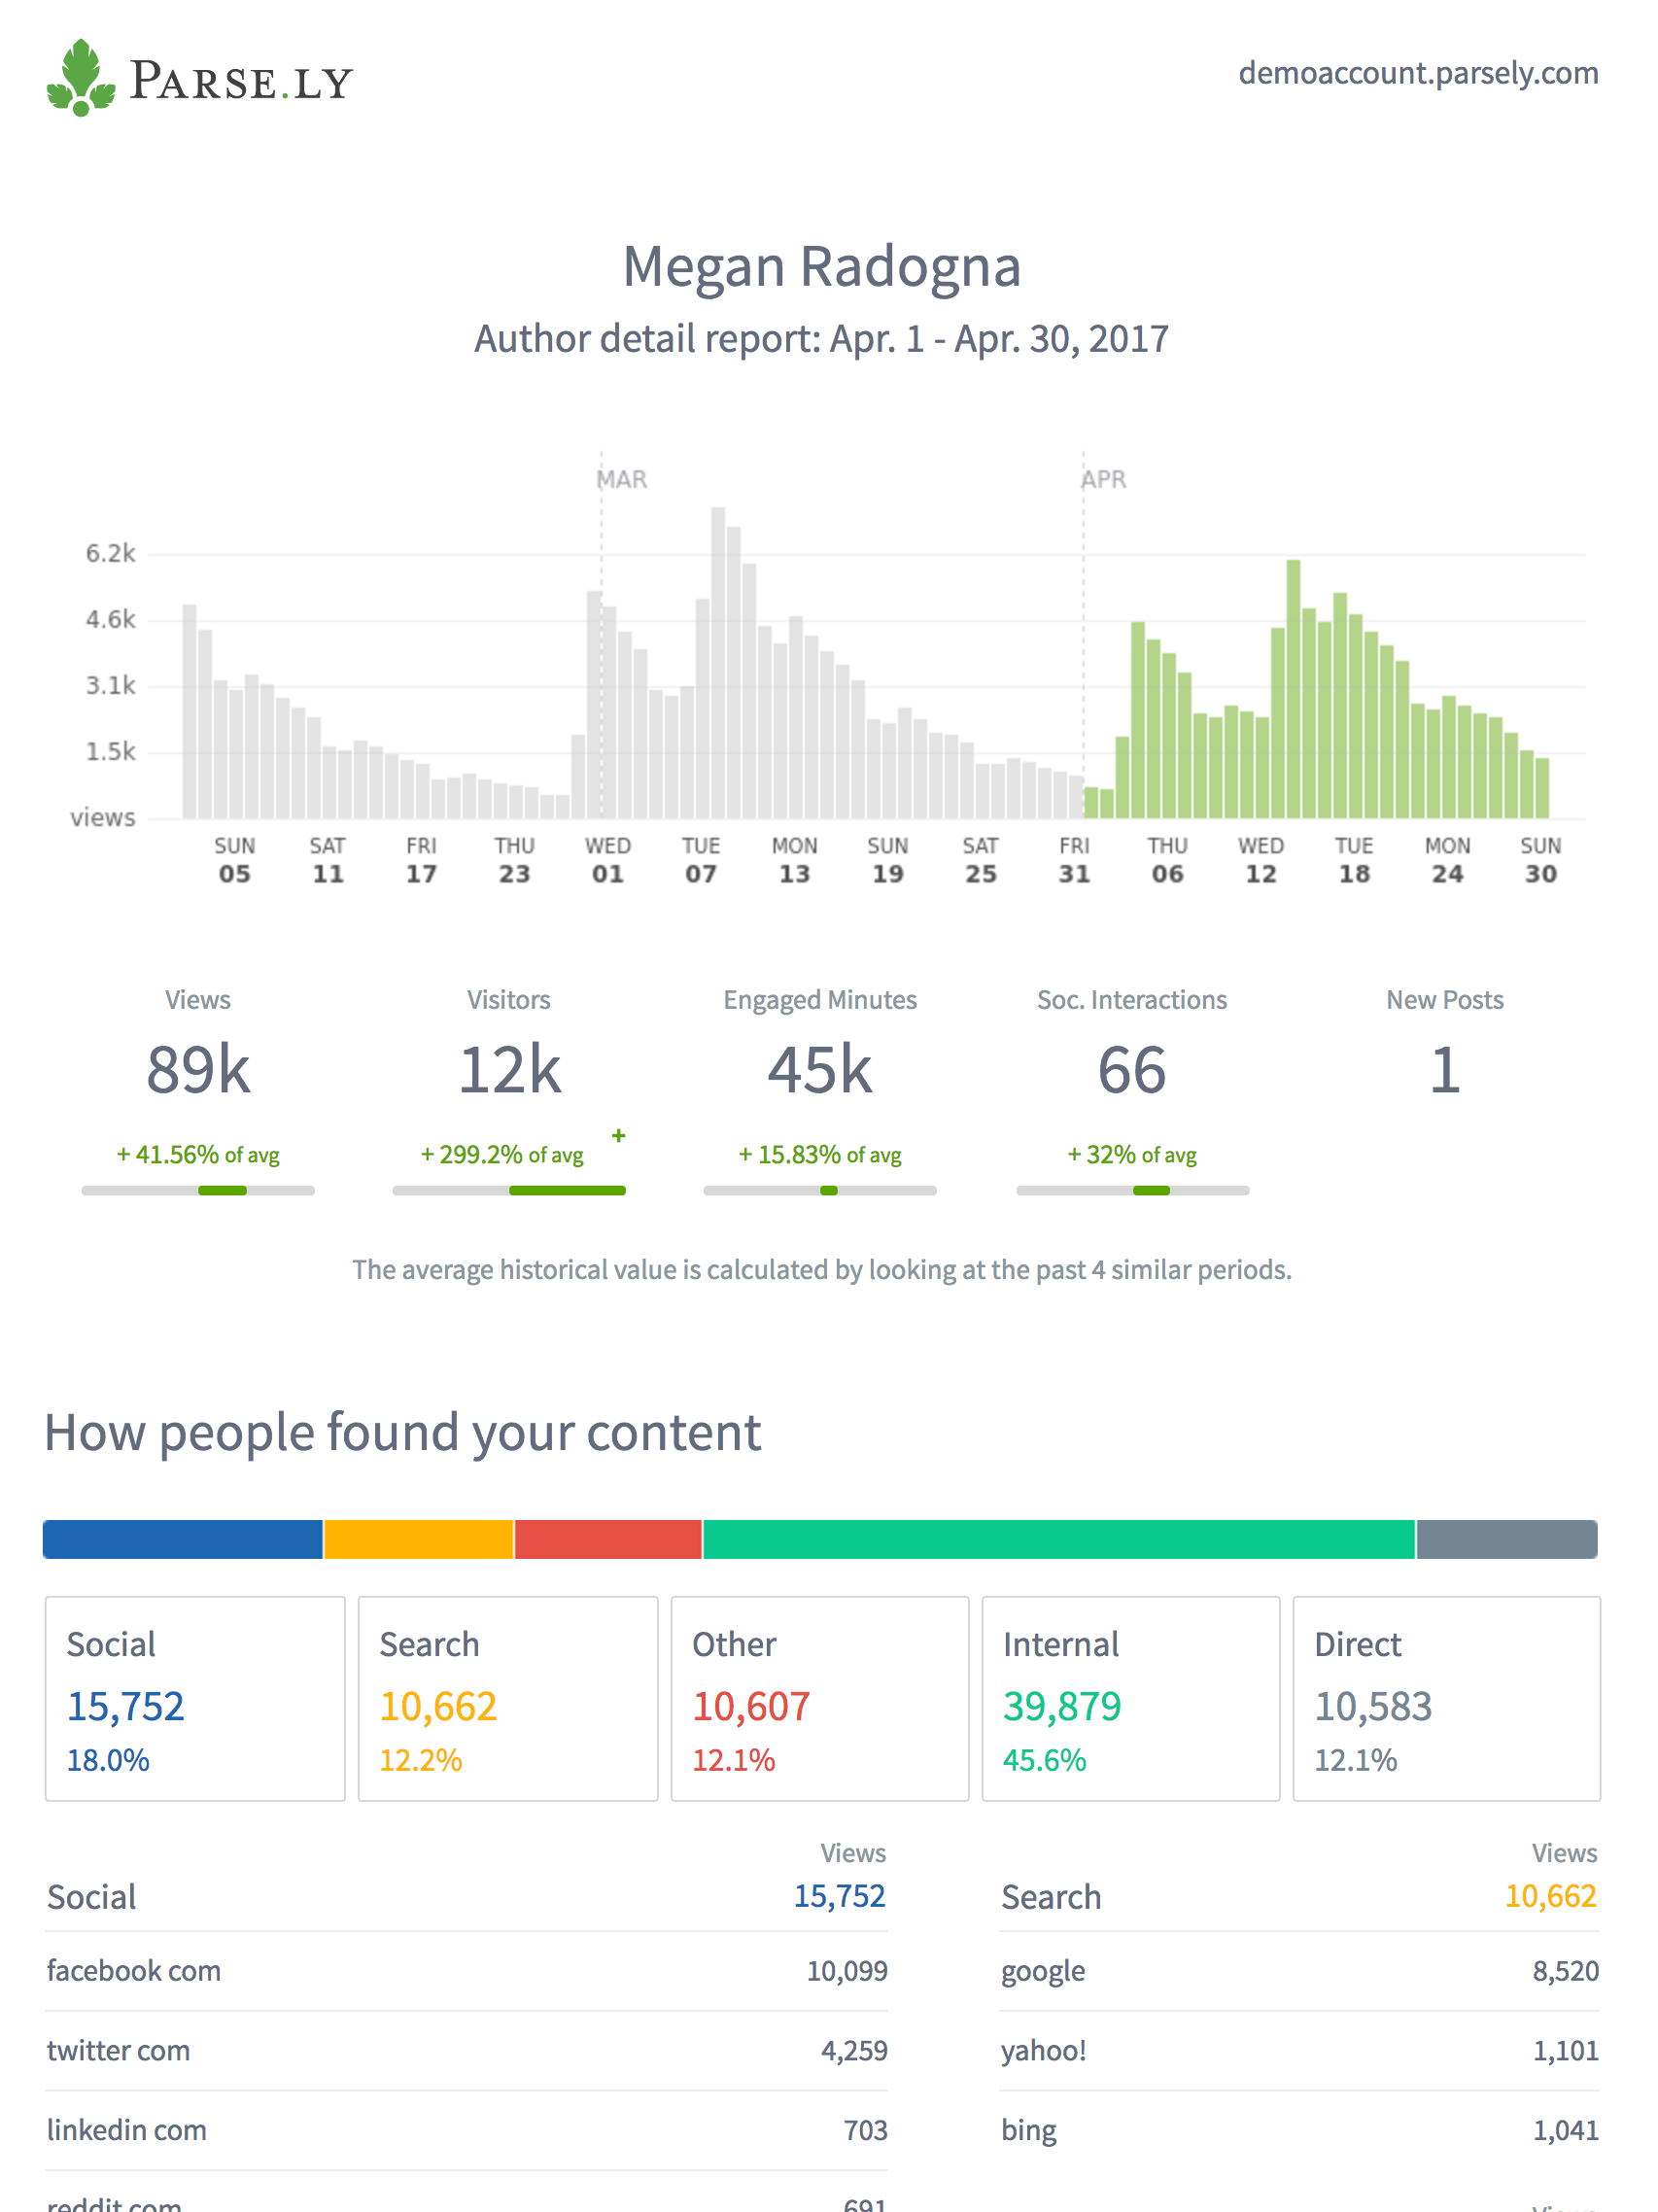
Author Details Pages
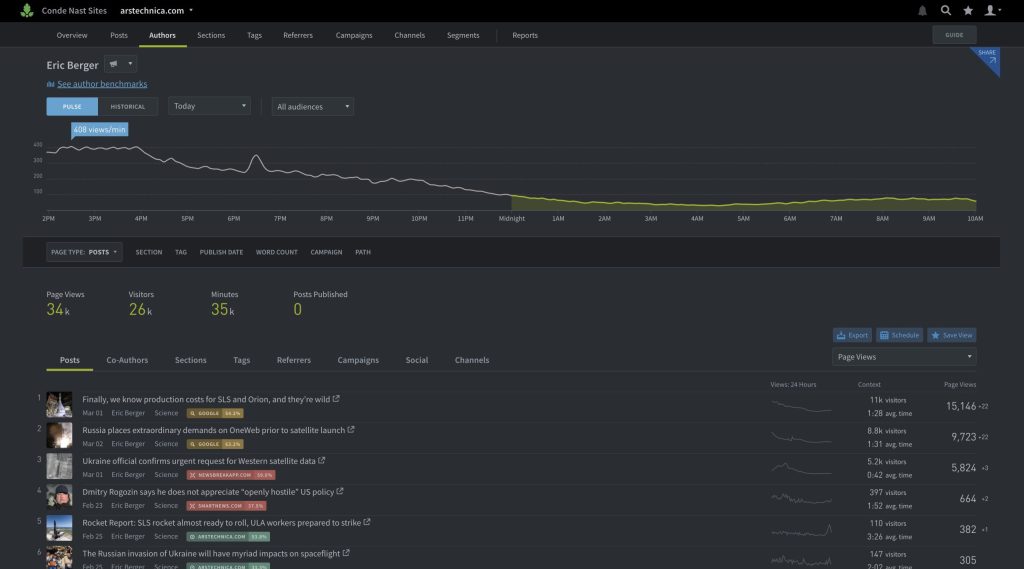
Just like we had post detail pages, clicking on a specific author will take you to their individual author page (we encourage all authors to bookmark their page!).
Rather than just looking at what does well for the entire site, an author can look at their top performing content over any time period.
- Has there been any more information that has come out since a top story was published? Write a follow up piece.
- Click the arrow next to each story to be brought to the post on your site and do some more digging. Did it include pictures or a video? How long was it?
Identify which sections and tags are doing the heaviest lifting for you.
- Top tags will help you identify your strengths as a writer and the topics that are really resonating with your audience. Struggling with your next story idea? Your top tags will help you brainstorm.
Your referrer section will show you where the audience for all of your stories comes from.
- Does your social audience make up a smaller % than social does for the overall site? This is your opportunity to identify areas for growth and implement strategies for growing a certain type of audience. You can monitor the change in numbers as you implement different strategies to see what works.
The share button in the upper-right allows you to share individual pages with those without Parse.ly logins.
- This is perfect for sharing personal author data with freelance writers without granting them access to the rest of the site’s data.
- Their page will be consistently updated with real-time data, so they can bookmark and reference.
- The link never expires.
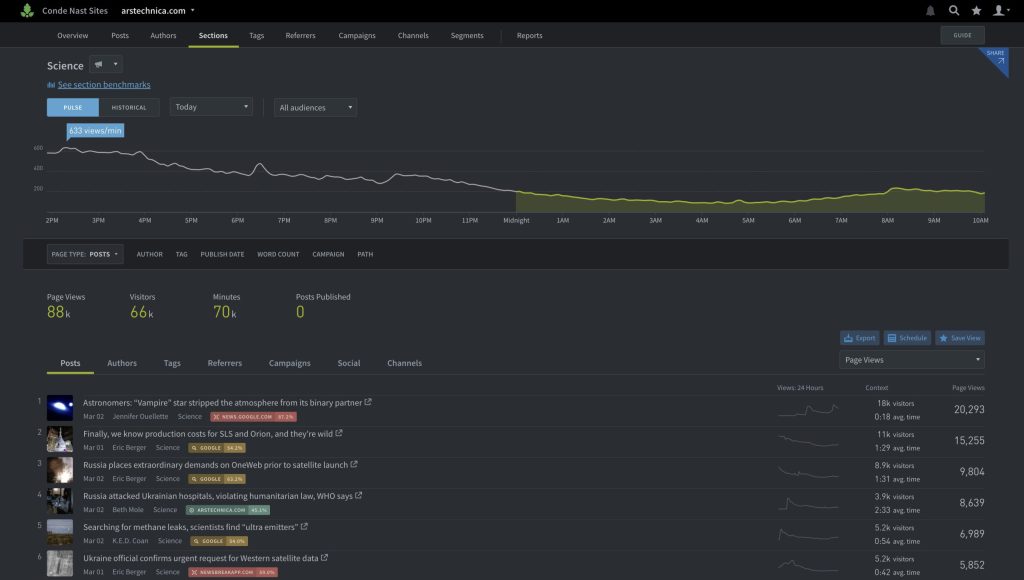
Top Sections and Section Details Pages
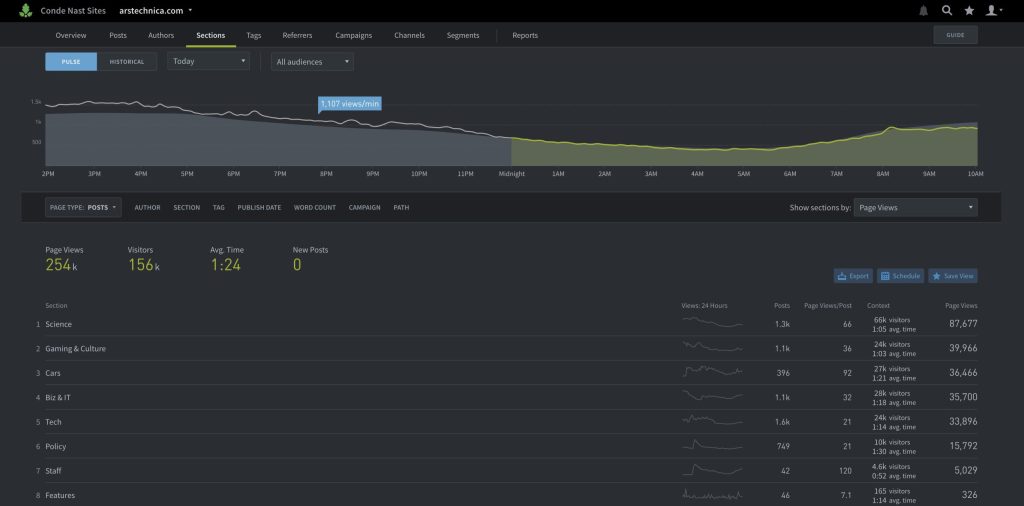
Like our other listing pages, Sections gives you the ability to see how sections compare to one another over any time period. Click into a section to se detailed information about sections. Section editors can see the top performing posts, authors, and tags as well as where the audience came from.
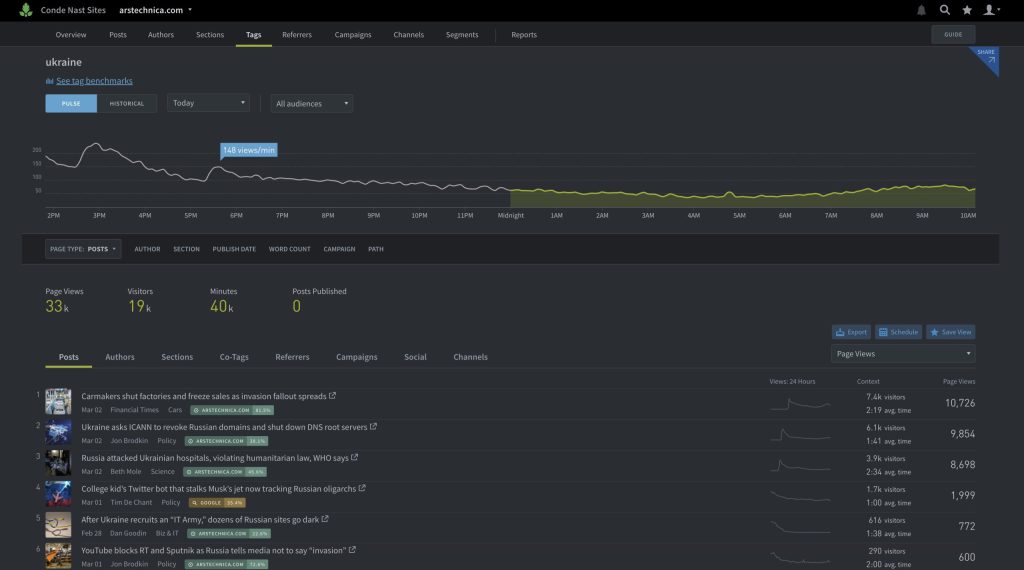
Top Tags and Tag Details Pages
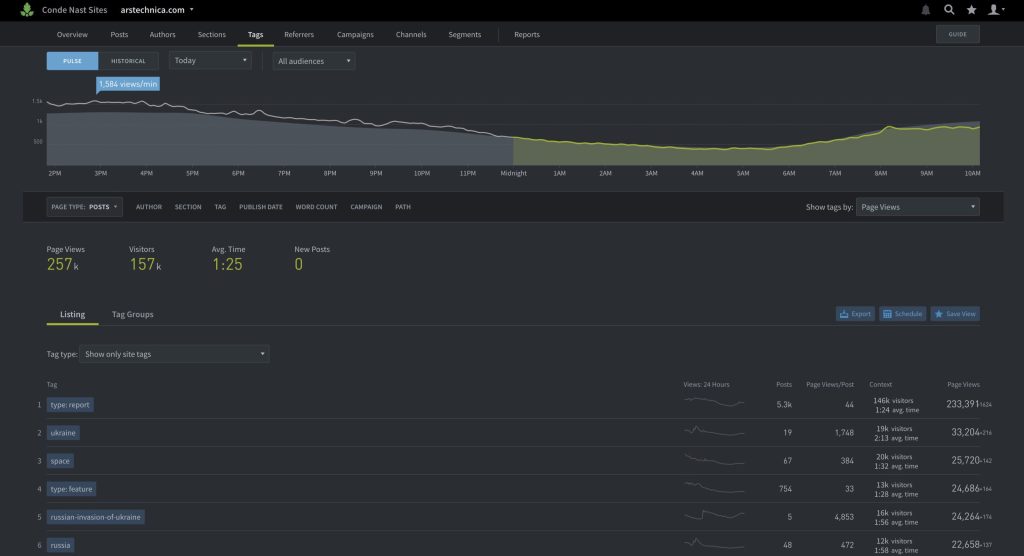
You guessed it- this page is laid out just like our other listings pages. Tags are a powerful way to categorize your content. Here are some ideas of how you can use this page in conjunction with your tagging structure:
- Tag with any relevant topic associated with a post whether that be a person, place, event, etc.
- Tag with content type (long form, short form, video, slideshow, etc.)
- If you have sponsored content on your site, tag the posts with the sponsor’s name or some kind of identifier.
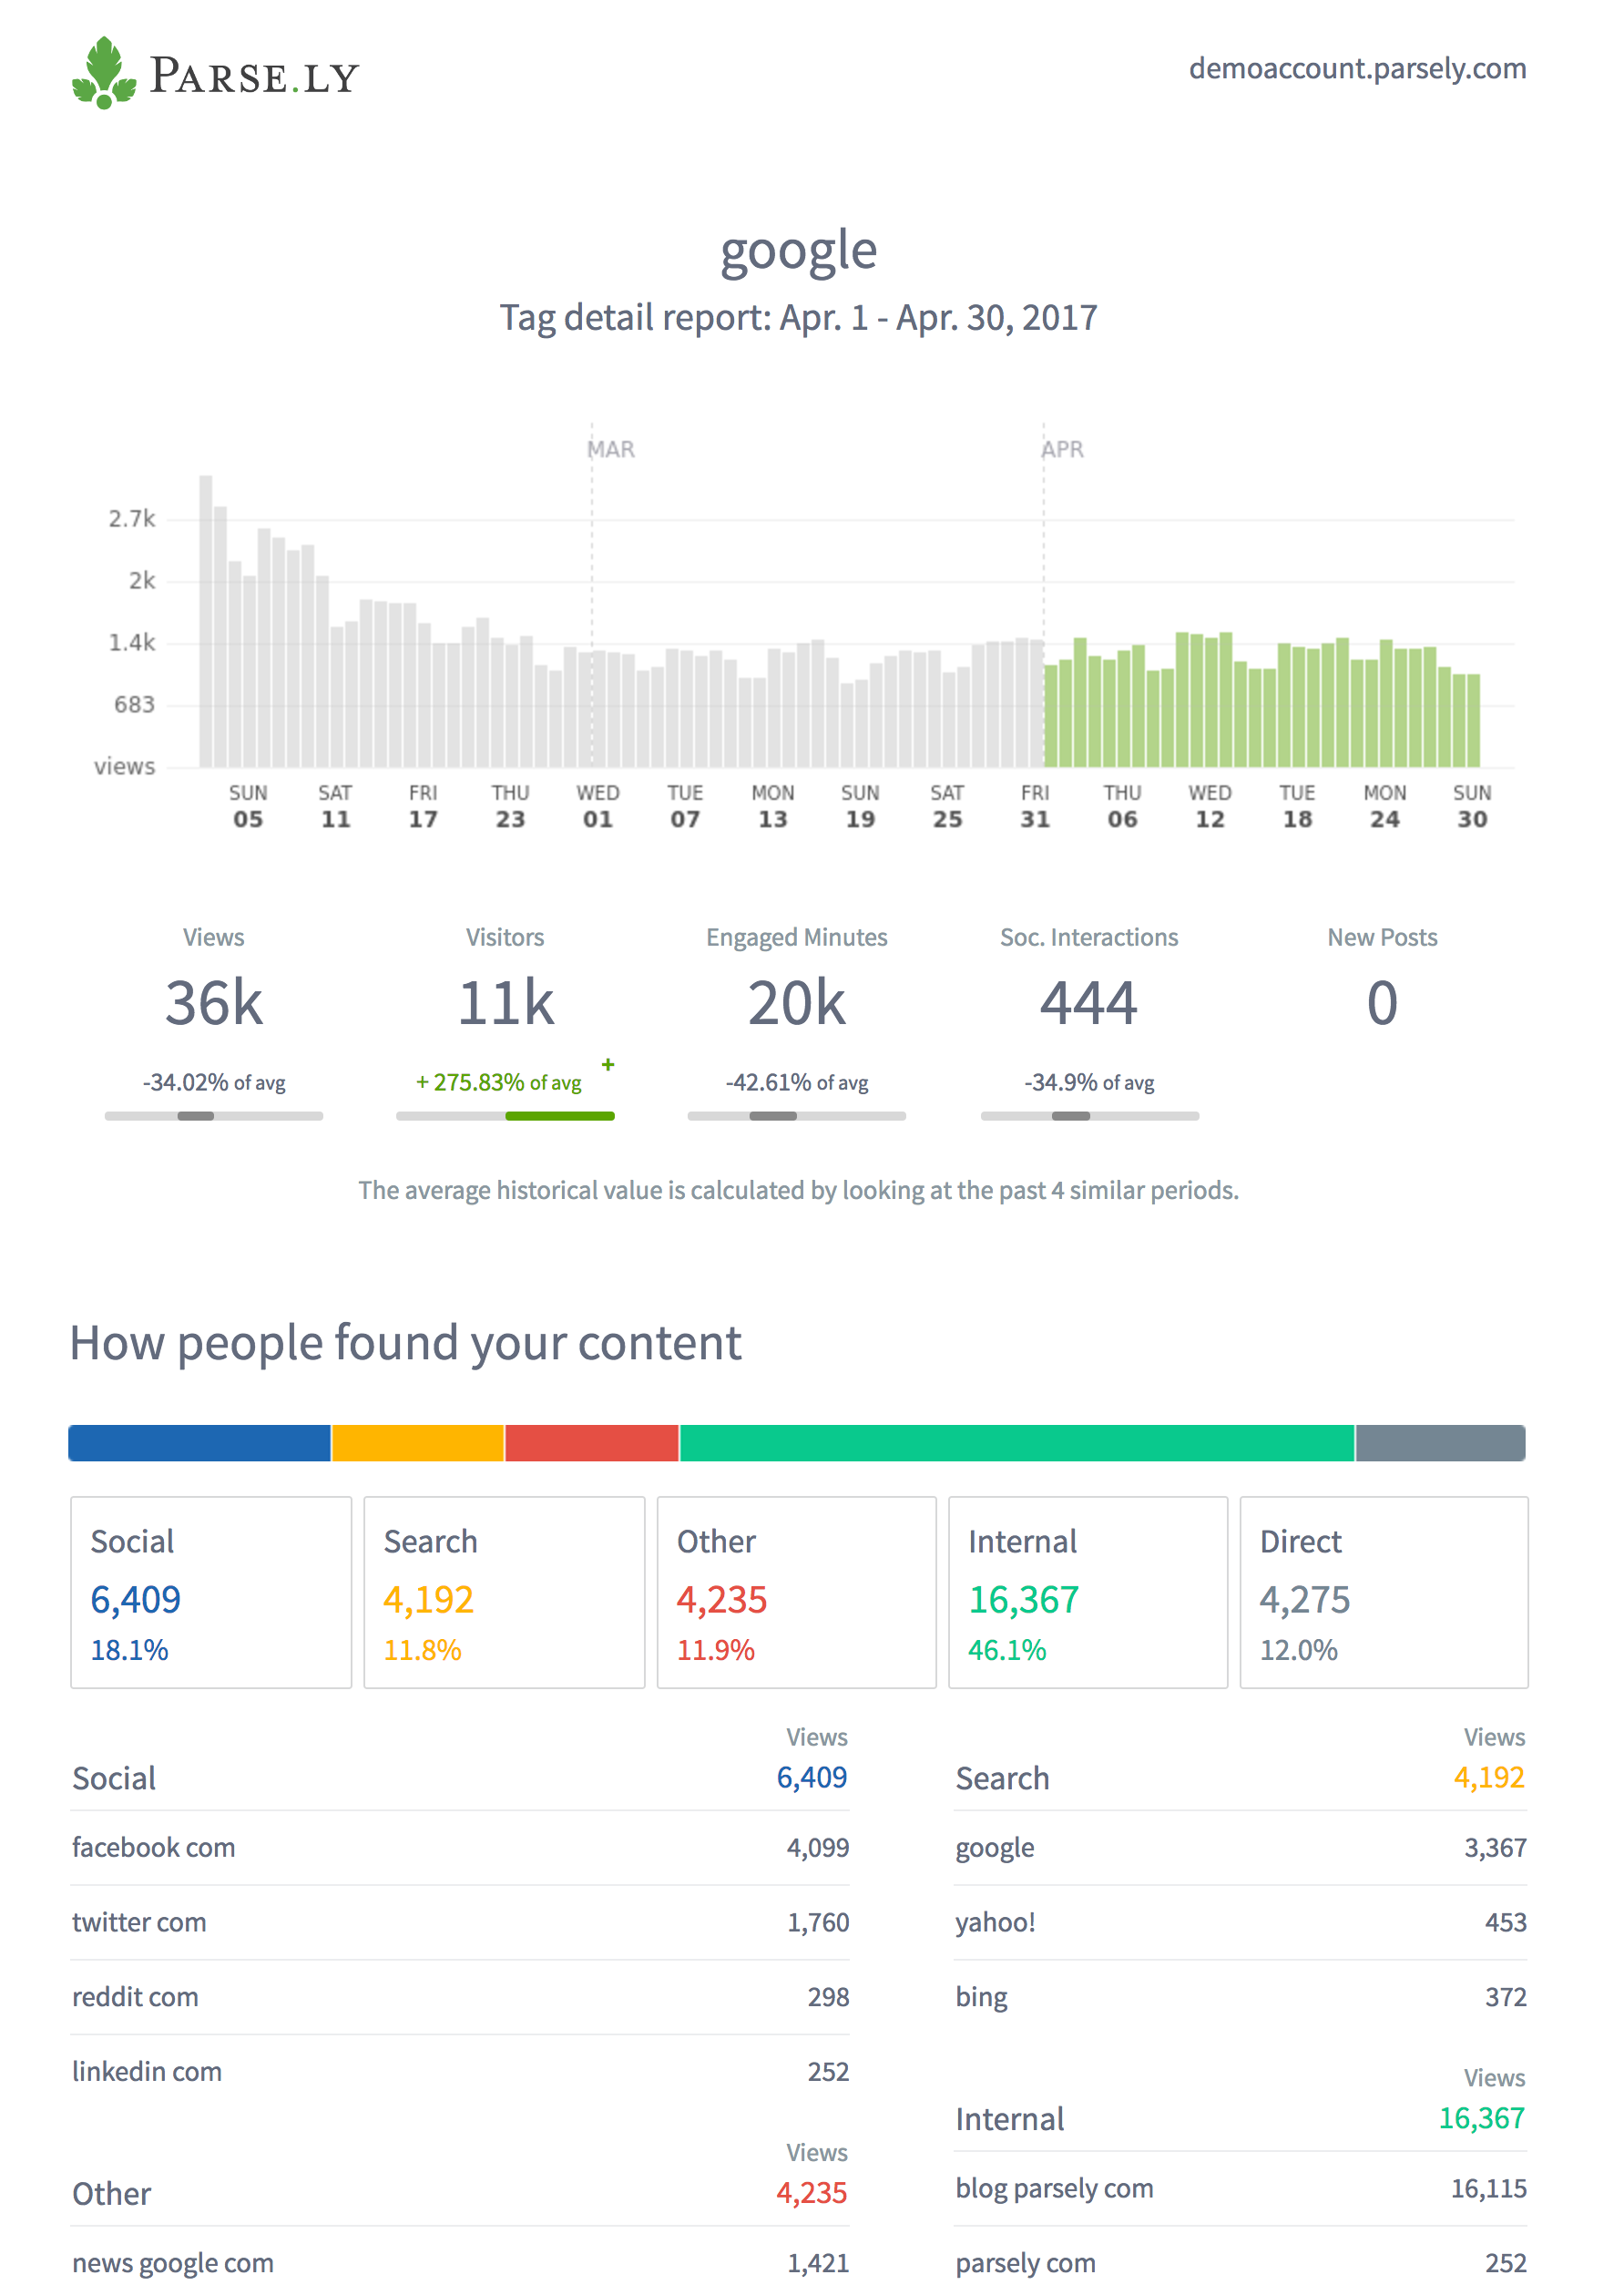
When a writer is about to start a piece, look into the tag detail page for that topic.
- See what posts have done well in the past and what the common traits are (headline/length/format).
- See the top performing authors who have written about this topic and talk to them about their sources, how they promoted it, etc.
- Find out where the audience for this topic came from. It could end up that articles on this topic work better when promoted some places than others.
- Use the share button to allow sponsors to see how their content is performing and provide full campaign transparency.
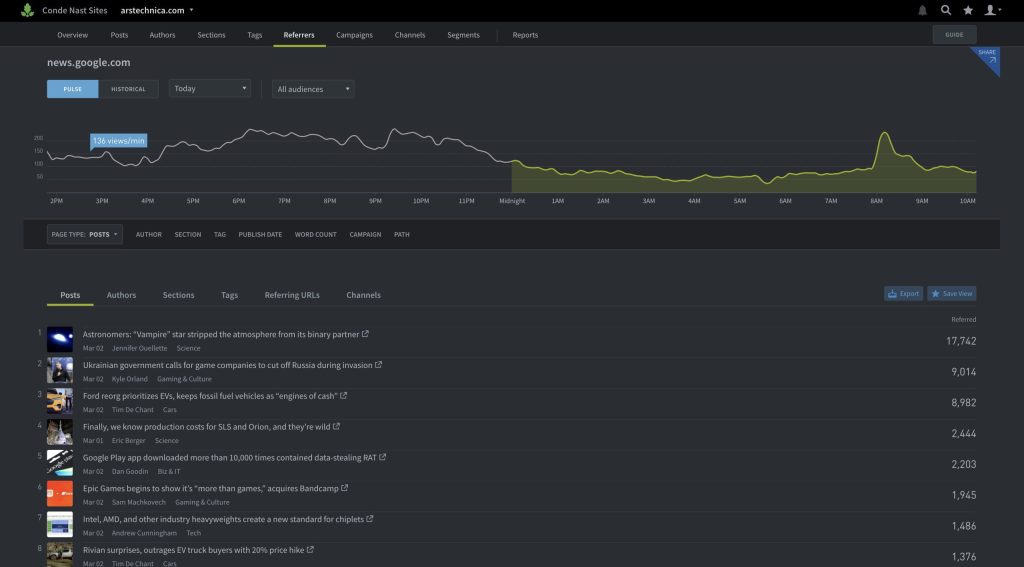
Top Referrers and Referrer Details Pages
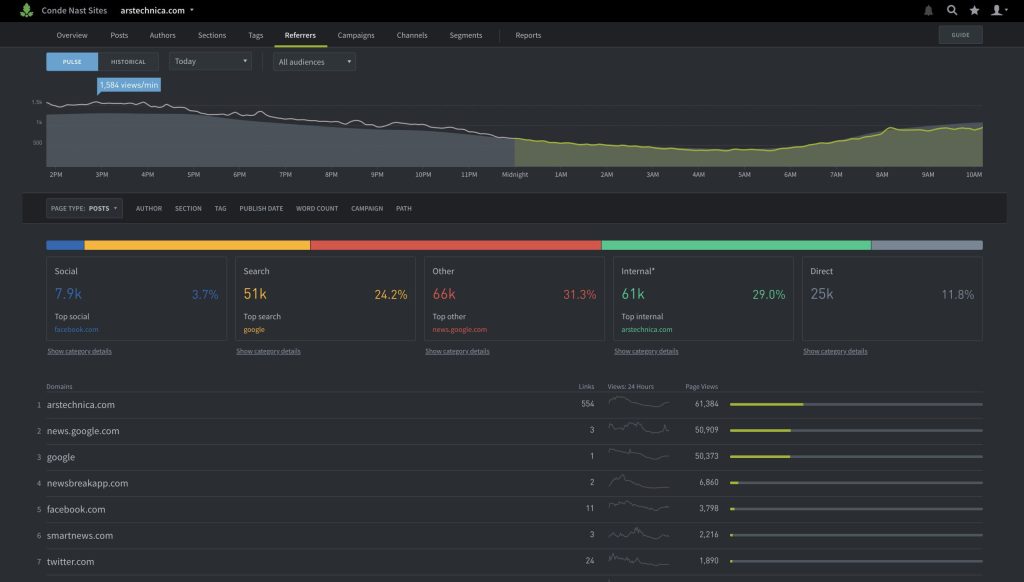
Here you can see a breakdown of how readers come to your entire website. Writers can easily compare their audience and their site’s audience to assess areas for growth.
Top Campaigns and Campaign Details Pages
Campaigns help you track how your team’s distribution efforts—digital advertising, social sharing, and newsletter programs—drive traffic to your site.
The Top Campaigns page offers a broad view of marketing campaign performance. Campaigns are divided into five categories: Campaign, Medium, Source, Content, and Term.
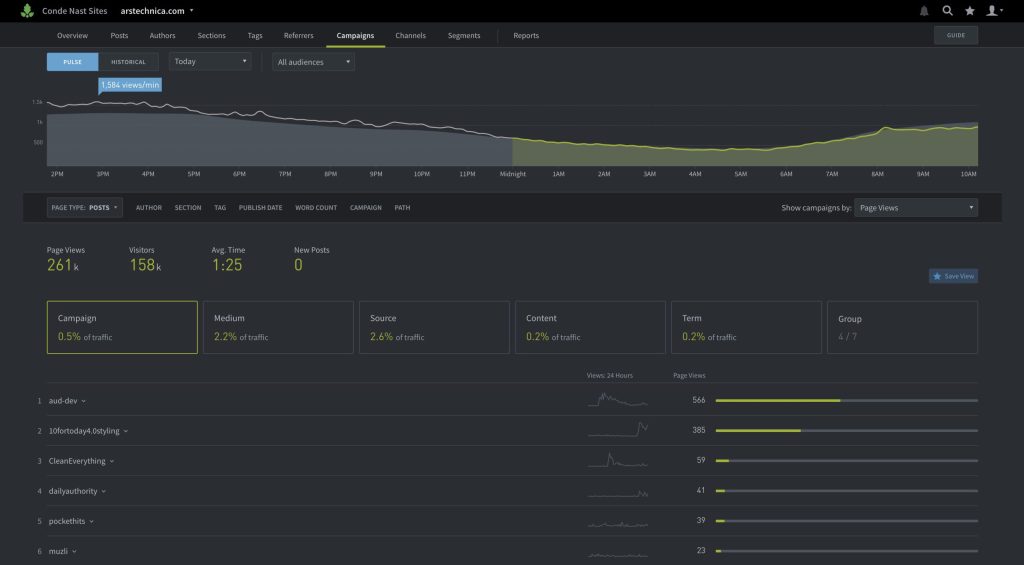
Campaign details pages allow you to evaluate audience engagement with a single campaign, medium, source, piece of content, or term in conjunction with related posts, referrers, and other campaign aspects.
Reports
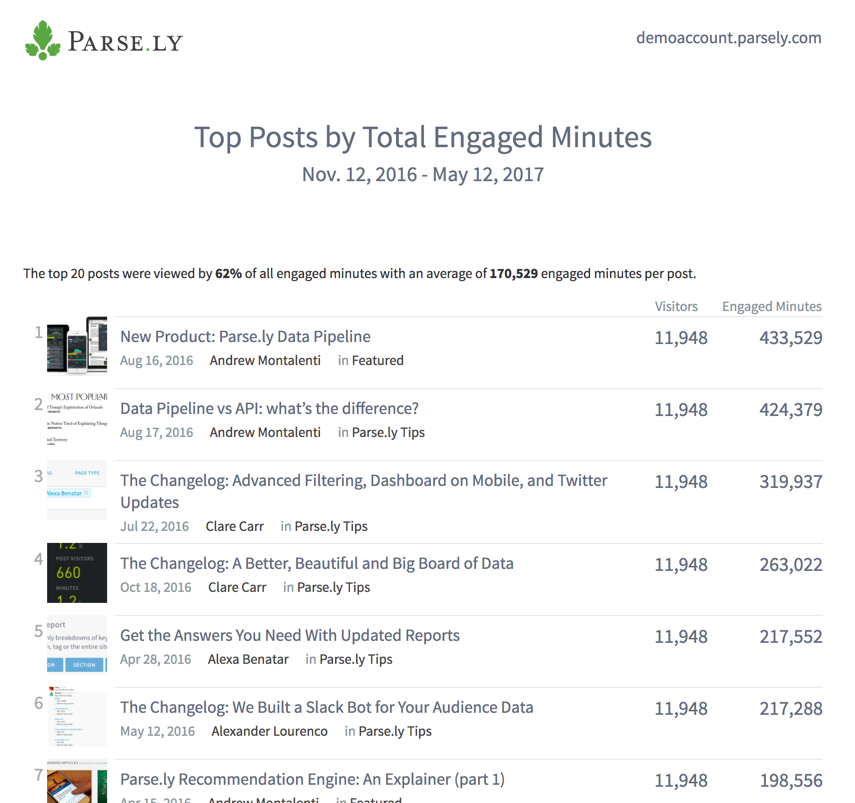
There are a number of reports that you can run in our reporting suite but here are a few of the most popular:
Recurring top listings report, select “Posts”, run every day, looking at yesterday (or every Monday looking at previous week)
- Note which content did well to inform what should be promoted on social, added to homepage, and kept an eye on for more updates.
Weekly Author Details report run every Monday looking back at the previous week.
- It may be tough to get authors logging into a dashboard every day when they have no analytics experience, but this easy to digest report will show them their week at a glance directly in an email.
Tag Details report, select a tag that corresponds to a sponsor.
- This beautiful report takes 2-3 seconds to run and takes all the effort out of reporting campaign numbers to a sponsor.
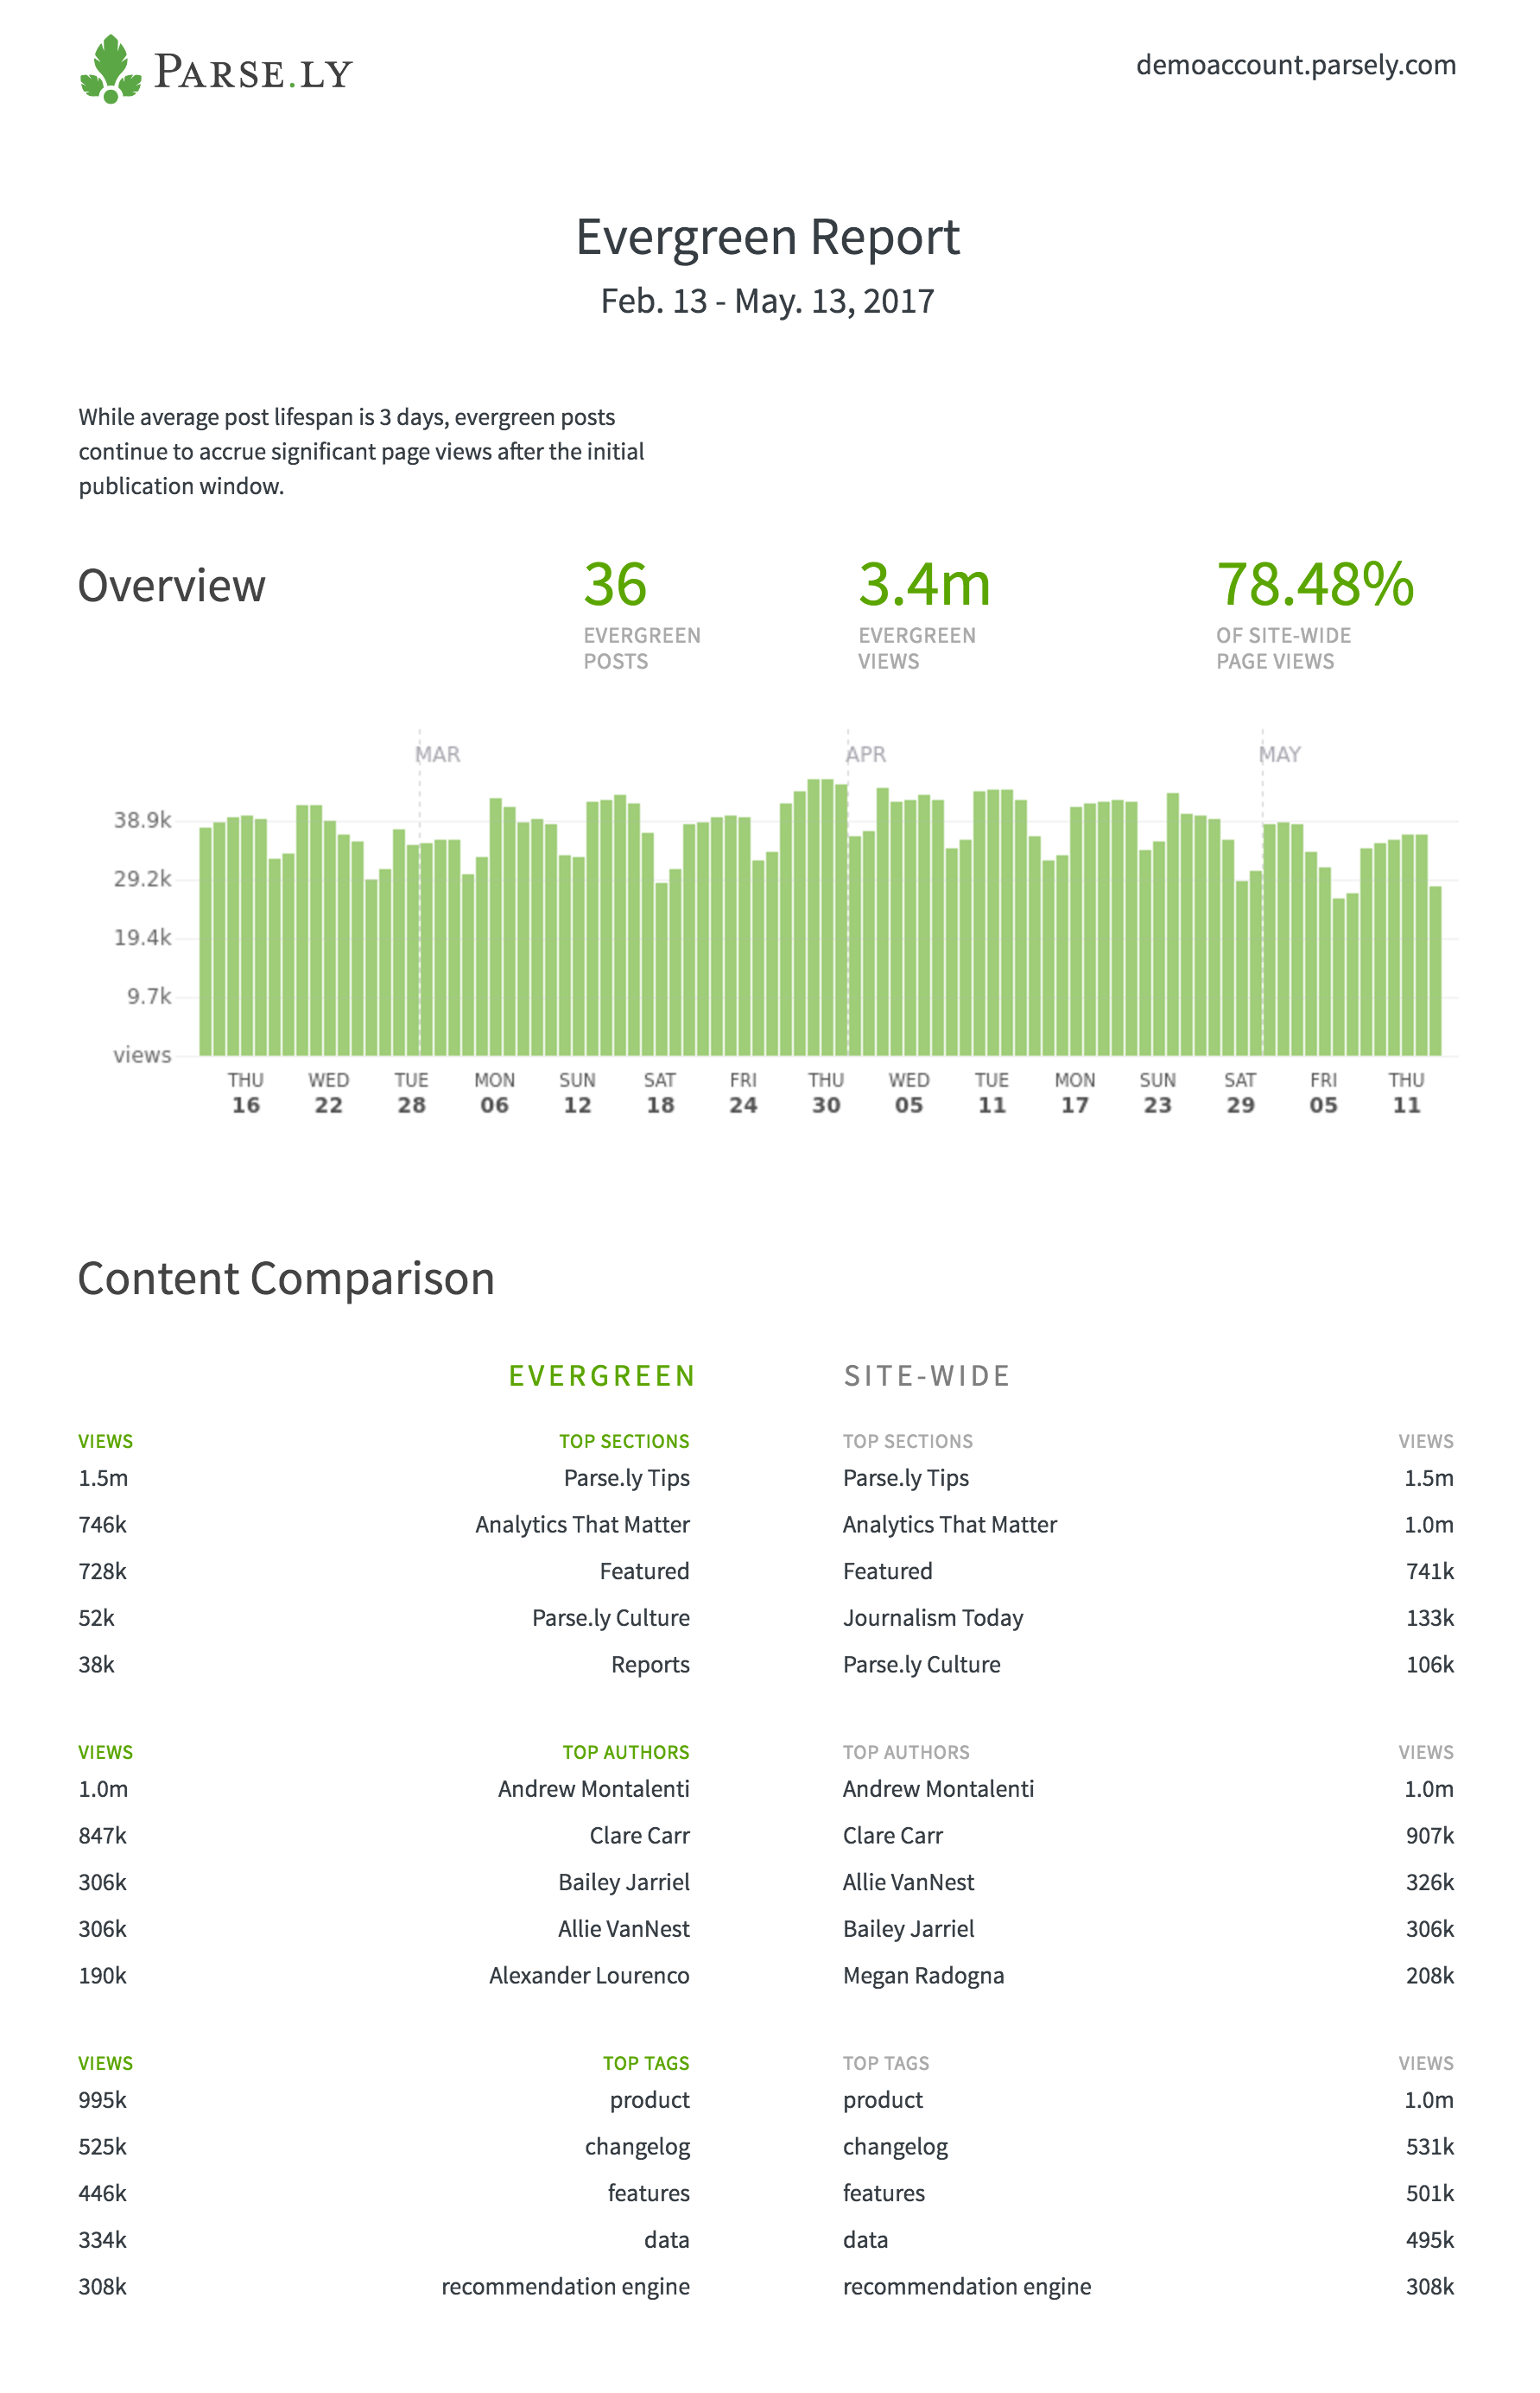
Use the Evergreen Overview report to surface all posts that are continuing to get significant traffic well after the average post lifecycle (about 3 days).
- Since these posts aren’t tied to a particular news event and continue to resonate with your audience, they are the best options for re-promotion (on social or homepage).
- Also important to note similarities among these posts to try to replicate in the future.
- Since these posts aren’t tied to a particular news event and continue to resonate with your audience, they are the best options for re-promotion (on social or homepage).
- Also important to note similarities among these posts to try to replicate in the future.
Last updated: April 02, 2024